This paper was originally prepared for The Housing Stabilization Committee, October, 1975, and then revised.
Providing adequate shelter for all Americans is a top social priority in the United States. The 1949 Housing Act called for “… a decent home and suitable living environment for every American family,” a statement that has been reiterated many times since 1949 and in some sense was responsible for the important 1968 Housing and Urban Development Act and subsequent legislation. This paper analyzes the way fiscal policy is used to achieve the nation’s housing priorities. Included is a review of the growth of government spending and a study of the impact on housing of the fiscal-monetary policy mix, federal housing outlays, federal tax expenditures, and federal credit programs.
Total government spending including federal, state and local units increased from 10% of gross national product (GNP) in 1929 to 33% in 1974. A large share of these expenditures can be attributed directly to the federal government whose outlays accounted for 21 % of GNP in 1974.
One way this expansion of the federal government has influenced housing is through the fiscal-monetary policy mix. Our analysis of overall stabilization policy disclosed a serious bias in the monetary-fiscal policy mix which has been increasingly adverse to housing in recent years. Large budgetary deficits even after high employment is reached have put undue pressure on monetary policy to correct for the resulting inflation. During periods calling for expansionary policies, the mix has been both favorable and unfavorable to housing although the 1974-75 period suggests that a heavy weighting toward fiscal policy can create demand expansion without bringing about a housing recovery.
Another way federal expansion has influenced housing is through budget allocations. A review of federal allocations to housing indicates that although housing has been given a great deal of lip-service as a national priority, the data does not substantiate this claim. Federal outlays for housing totaled less than 1 % of GNP in 1974. Further, the impact these outlays do have actually acts to exacerbate the industry’s instability. As a result of this instability in housing, the U.S. had far exceeded its cumulative housing goals as of fiscal 1973. Even after the record production declines of fiscal 1974-75, the nation is only modestly below its cumulative target as of fiscal 1975. However, it is clear as of fiscal 1976 that in the next three years (1976-78) total housing production will be far below the nation’s 1970 housing goals. This failure to realize our nation’s housing goals will take place despite the fact that federal spending is expected to continue to expand to 22% of GNP.
Federal tax expenditures grew rapidly during the late 1960s and early 1970s. Although this form of federal expenditure has decreased in importance in some areas, it has increased in its importance to housing. During the relative instability of the early 1970s, housing tax expenditures have stabilized housing.
Federal credit programs have grown significantly during the last decade (1965- 1974). When the size of the federal deficits of the 1970s is taken into account, it is clear that the federal government has been requiring an even larger proportion of the funds available to U.S. credit markets. These trends are projected to continue as federal credit needs reflect increasing deficits in 1976.
Federal credit programs for housing have been a large part of this expansion. Although these programs have increased housing stability by providing subsidized mortgage funds, they have done so at the expense of private intermediaries which is evidenced by the artificial downward pressure on mortgage rates and by the increasing usurpation of the mortgage market by federal agencies. This harmful impact on private intermediaries has a destabilizing effect on housing as private lender uncertainty increases.
The increasing size of federal spending, federal deficits, federal tax expenditures and their changes in composition reveals the increasing tendency of the federal government toward immediate consumption and away from the savings-investment area. This orientation implies the possibility of a capital shortage in the 1980s with obvious rel4ted difficulties for housing. Even if a capital shortage is not realized, this orientation in itself has the potential for creating continuing housing instability.
The Federal Budget
Perhaps the easiest of economic laws to substantiate is Wagner’s “law … This simply asserts that there is an inherent tendency on the part of government to increase in size and importance.[1] The growth of federal, state and local government in the United States during the past half-century provides empirical proof that this tendency does exist.[2]
In 1929, government revenues totaled $11.3 billion while by 1974 they were $455.0 billion. This represents a 40-fold increase over a period of 45 years with government revenues increasing from a rate of less than $1 billion a month to nearly $1.3 billion a day. The growth of government expenditures has been similar to that of revenues. Between 1929 and 1974 government expenditures increased 45-fold from $10.3 billion to $460.9 billion. This represents an expenditure increase from $28 million a day in 1929 to $1.3 billion a day in 1974.[3]
Clearly all forms of spending have increased over this span of 45 years. The nation’s gross national product experienced nearly a 14-fold increase going from $103.1 billion in 1929 to $1,397 billion in 1974. Real growth of the government sector then is not revealed by revenue and expenditure trends alone. We can envision the real growth of government, however, if we consider the percentages of the nation’s total product (GNP) consumed by government. In 1929, government spent 10% of the nation’s total product—$1 out of every $10. By 1974, government was spending 33% of GNP or $1 out of every $3—more than a threefold increase in real government size.
Between 1929 and 1974, federal expenditures alone grew from $2.6 billion to $299 billion—a 115-fold increase. This represents better than a fivefold expansion of federal claims on the nation’s total product—from 3% of GNP in 1929 to 21% in 1974.[3]
Fiscal Policy
The growth of government influences housing in many ways. One way housing is affected is through the nation’s overall fiscal policy. The relationship between government spending and taxation—the existence of federal budget surpluses and deficits—is usually referred to as fiscal. The overall objective of fiscal policy is to eliminate the gap between aggregate demand and non-inflationary, full employment level of output. The two basic targets of fiscal policy are then price stability and maximum production. Fiscal policy cannot, however, be reviewed in isolation, but must be discussed in the context of overall stabilization policy which rightfully includes monetary policy. Presumably we can have the same overall production with an equally tight fiscal policy and an easier monetary policy or the reverse within some limit. The choice depends primarily on the formulation of our many subsidiary economic goals or targets which are presumably affected differently by the fiscal-monetary mix.
These subsidiary economic goals are at the nexus of the housing debate in so far as it relates to choosing the •• appropriate” fiscal-monetary policy mix. It is generally conceded by economists that the policy mix does influence the composition of our economy’s output. Housing clearly represents a subsidiary goal that may well be affected.
Although a number of recommendations have been made regarding the role of fiscal policy in meeting our housing goals, unanimity has not been achieved. As one reviews the literature, however, there does seem to be a general consensus of opinion over several issues related to the question of how the fiscal-monetary policy mix influences or should influence the economy and housing expenditures.[4] The major differences occur in the weight given by various analysts to the overall importance of these influences. General points of agreement or propositions include the following:
Proposition #1
The primary goal of monetary and fiscal policy is to produce full employment output with price stability. Housing, while an important subsidiary goal, must be considered only as a secondary concern together with a number of other subsidiary goals such as: 1) the level of interest rates; 2) possible dislocations within the financial system; 3) balance of payments; and 4) effects of stabilization policy on the long-run growth rate of supply in the economy.
Proposition #2
The short-run effects of fiscal policy on the nation’s output and employment are generally agreed to be quick and significant. Irrespective of the economic doctrine of the economist, a sharp acceleration or deceleration of government spending are assumed to have fairly strong short-term effects of aggregate demand. Monetariests concede this point, but hold that rises in government spending financed by taxes or sales on bonds to the private sector will eventually “crowd-out” private spending by nearly an equal amount over the long-run.
Proposition #3
The composition of federal spending is assumed to have long-run effects on the rate of supply capacity growth in the economy. That is to say, a fiscal policy that re-allocates resources away from current consumption to investment will alter the long-run growth rate of potential output. Also, fiscal policy can alter the long-run supply of housing by direct expenditures on new housing, rehabilitation, resources going into housing and manpower training.
Proposition #4
Housing as a credit intensive durable good, is likely to be more adversely affected by a fiscal-monetary policy mix which puts its primary restraining responsibility on monetary policy as opposed to fiscal policy. That is to say, if we have the choice between two fiscal-monetary policy mixes, both of which are assumed to create the same overall aggregate level of demand and similar inflation rate, the policy mix which calls for the more restrictive monetary policy and less restrictive fiscal policy will be the most detrimental to the housing market.
Proposition #5
Fiscal policy can do little by itself to promote housing goals, but must be coordinated with monetary policy to produce the desired outcome. The objective must be to select a total gross national product-employment target which is consistent with some level of acceptable inflation, then select the appropriate combination of monetary and fiscal policy which will achieve the overall output and prime objectives but which also comes closest to achieving the required amount of housing.
Impact
Assuming general agreement with the above propositions, we might choose to review the extent to which fiscal policy during the last several decades has favorably or adversely impacted the housing markets. Such an evaluation is difficult for several reasons. First is the problem of the potential lack of coordination between fiscal and monetary policy. Clearly, a particular fiscal policy must be considered inappropriate if it resulted in undesirable outputemployment, price, and housing outcomes and such a policy was determined with “perfect knowledge” of the monetary policy actually to be carried out. Unfortunately, fiscal policy can hardly be faulted for an undesirable outcome which occurred because the monetary policy pursued was unexpected or inappropriate. Nor can fiscal policy be criticized for bad forecasting of the outcome of any given policy. Finally, fiscal policy cannot be blamed for adverse housing conditions which are the natural consequence of the pursuit of more important primary or subsidiary goals.
These difficulties make it impossible for us to place blame, but they do not stop us from evaluating policy solely from the more narrow point of view of how the policies pursued affect housing output. In other words, while we might accept the notion that fiscal policy is blameless, we need not reject the temptation to evaluate the policies pursued for the narrow viewpoint of what would have been in the best interest of housing.
This presents another problem, however. Should the fiscal policy chosen be evaluated under the assumption of “full knowledge” of the monetary policy that was pursued? Or conversely, should monetary policy be evaluated under the assumption of full knowledge of the fiscal policy that was pursued? This chicken and egg problem is not easily solved even though most analysts assume monetary policy can be adjusted more quickly than fiscal policy. Nor is the problem of determining what the primary overall output, employment and inflation goals are for any given year. This latter problem is particularly important since housing, as a subsidiary goal, must be considered subservient to these other primary goals.
Given these problems, it is clear that any approach taken to the question of how fiscal policy affects housing must suffer from the criticisms of subjectivity and unrealistic assumptions.
Our approach will be to determine the extent to which fiscal policy has historically tended to foster favorable or unfavorable conditions for the housing market. From the above propositions, particularly propositions #4 and #5, there is general agreement that when fiscal policy assumes too great a stimulative role when expansionary policies are called for in relation to monetary policy, or similarly, where monetary policy assumes too great a restrictive role when deflationary policies are called for as compared to fiscal policy, that housing will suffer adversely. Our effort will be to determine the incidence of these occurrences during the last several decades.
One way of measuring fiscal impact in a full employment framework is the “high” or “full employment budget.”[5] The high employment budget is a method of estimating the total revenues and expenditures of government under the assumptions of full employment and some estimate of potential long-run growth in output. Although there are many estimation, weighing, and timing problems associated with its computation, the budget does provide a useful indicator of the direction of discretionary fiscal action by isolating the effect of fiscal policy from the influences of changes in the level of economic activity on the budget data.
From the above discussion, it would appear that fiscal policy could be detrimental to housing under the following conditions:
1) If fiscal policy is stimulative when full employment is approaching or present then there is a tendency for such a fiscal policy to force monetary policy to burden too great a responsibility for slowing the growth in aggregate demand. Such a policy would be detrimental to housing since monetary policy works through the credit markets which is particularly burdensome to the housing sector.
2) If fiscal policy is too stimulative during a period of recession, then monetary policy is unable to ease commensurately as much as if a more balanced fiscal-monetary mix was employed. Such a policy will have a relatively smaller stimulative effect on housing than on other less credit intensive sectors of the economy.
3) If fiscal policy is too restrictive during a period of recession or excess unused capacity, then monetary policy may be forced to be overly stimulative, leading to excessive rises in homebuilding.
4) If fiscal policy is too restrictive during a period of fully utilized capacity, then monetary policy may result in relatively too much in resources being devoted to housing.
The occurrence of these four policy mixes during the last several decades is surprisingly evenly distributed, although through time there is not an equally random occurrence.
The following assumptions are made in analyzing the impact of fiscal-monetary policy mix on housing.
Assumption #1
It will be assumed first that during periods when the wholesale price index is rising at, near, or above a 5 % rate and unemployment is less than or equal to 5% that stabilization policy will be aimed at deflating aggregate demand.
Assumption #2
It will be assumed that during periods when unemployment is in excess of 5% and when prices are declining or stable that stabilization policy will be aimed at expanding aggregate demand.
Phases
The quarterly high-employment budget and the annual percentage increase in M1 (cash and demand deposits in commercial banks) and M2 (M1 and time and savings deposits in commercial banks) was evaluated for the period 1950-75. There are four periods when stabilization policy is assumed to be deflationary. There are four periods when stabilization policy is assumed to be expansionary. Each period is also evaluated on the basis of whether the fiscal-monetary mix was favorable or unfavorable to housing. In periods of deflationary goals, a policy weighted in favor of monetary policy is considered negative to housing, while a policy weighted in favor of fiscal restraint would be favorable even though housing would be expected to suffer in either case. In periods of expansionary objectives a fiscal-monetary mix weighted in favor of monetary stimulus is considered positive to housing and vice versa. In both cases, a wellbalanced policy is considered neutral.
Deflationary Phases
- II 1953 – III 1953 (Negative) | Complete reliance on monetary policy to slow economy. Full employment deficit increased stimulus from $9-10 billion
- II 1955 – IV 1956 (Negative) | Monetary policy tightened. . Balance between monetary and fiscal policy slightly weighted to monetary policy. Sharp tightening of monetary policy and moderate additional restraint of high employment budget.
- IV 1968 – IV 1970 (Neutral) | Balance between monetary and fiscal policy. Very sharp tightening of monetary and fiscal policy.
- IV 1973 – II 1974 (Negative) | Balance with emphasis on monetary policy. Moderate tightening of fiscal policy and relatively sharp tightening of monetary policy.
Expansionary Phases
- II 1954 – II 1955 (Positive) | Sharp expansion of monetary growth and tightening of fiscal policy.
- I 1958 – II 1964 (Positive) | Monetary policy with the exception of 1959 was progressively more stimulative while fiscal policy remained relatively restrictive.
- III 1970 – IV 1972 (Neutral) | Sharp easing of both monetary and fiscal policy.
- IV 1974 – Present (Negative) | Very sharp fiscal stimulus and moderate monetary stimulus.
Our simple subjective analysis indicates:
- During deflationary phases stabilization policy is heavily weighted toward the use of monetary policy. Rarely does fiscal policy provide sufficient restraint to balance the policy mix. Thus, during periods when deflationary outcome is desired, the fiscal-monetary mix has tended to be adverse to housing.
- During expansionary phases of stabilization policy, the fiscal-monetary mix has been both favorable and unfavorable to housing.
- Over the period covered, the tendency has been to use a relatively heavier weighted monetary policy mix during deflationary phases and heavier weighted fiscal policy mix during expansion phases. This is born out by the fact that the only positive fiscal-monetary mix took place during the mid-1950s and early 1960s.
These trends would suggest that housing may have experienced difficulties in recent years as a result of the increased tendency to weigh monetary policy more heavily than fiscal policy during deflationary phases of stabilization policy, and fiscal policy more heavily during expansionary phases. Both tendencies are generally less compatible to a strong housing market and available mortgage credit.
Housing Outlays
Another way the federal government impacts the housing market is with its allocation of expenditures for housing. In this regard, housing must compete with other national priorities for funds. As a result, the amount of federal expenditures for housing does reflect at least to some degree the national priority status of housing.[6]
Housing as a national priority fits somewhere in between the foregoing examples. In 1965, federal outlays for housing totaled about one-half billion dollars while by 1974 they were nearly $5 billion—a tenfold increase in nine years. This rate of growth implies that housing has been an increasing national priority over the past decade. This impression is confirmed for the period 1965-1972 as housing outlays increased from 0.4% of total federal outlays to 1.9% and from 0.08% of GNP to 0.4%. However, in 1973 and 1974 federal housing outlays did not meet their 1972 levels representing only 1.75% of total outlays and 0.36% of GNP in 1974. Although housing has been an increasing national priority during the last decade, the trend did not continue upward during 1973-74.
More surprising than this reversal of trend, however, is the overall size of federal housing expenditures. Housing outlays representing less than 2% of total federal outlays—less than 0.5% of GNP—can hardly be seen as reflecting a major national priority. [7]
Goals
In spite of the small size of federal housing outlays, they do hold a significant potential for impacting housing production. Two ways in which the degree of use of this potential can be examined involve housing goals and housing stability. Ideally, the federal government should be capable of adjusting its spending to achieve specified housing production levels which reflect both improved housing for the population and stability in production.
ln 1969, the nation’s housing production goal was set at approximately 26 million new units over the next decade and a production schedule was established. This goal was revised to 25.5 million new units and 1.0 million publicly-subsidized, rehabilitated units in 1970. Since then a number of studies have been done estimating our nation’s housing needs with estimates ranging from 22 to 29 million new units over 10 years.
Attainment of the 1970 production schedule on a cumulative basis was fairly good between fiscal 1969 and 1975. The cumulative target for 1975 was 16.3 million new units while 15.2 million were produced. As of fiscal 1975, the nation has achieved 93% of its target for the period 1969-75.[8] This success, however, has not been achieved in a stable, healthy manner. In fiscal 1971, production was 13% over its target followed by a 25% over-shot in 1972 and 15% over-shot in 1973. Then in 1974 actual production fell 23% below its goal followed by an even more pronounced fall of 55% in fiscal 1975. The sharp declines experienced in fiscal 1974 and 1975 indicate that even with a strong housing recovery in 1976 the nation will be well below its housing goal for the decade.
Another way housing production could be expected to be influenced by federal housing outlays is in the form of subsidized new units. In 1965, 48 thousand new subsidized units were produced representing 3.2% of total new unit production in that year. In 1974, these units totaled 45 thousand—only 3.4% of total production. Subsidized housing units represent only a small share of housing production and thus do not have a major impact.[9] Further, the number of subsidized units produced per year does not reflect a federal government attempt to use this source of impact as a method of stabilizing housing production. If these units were being used to aid housing production, they should increase as production falls below target levels and fall when production exceeds the annual goal. This has not been the case as subsidized production averaged 13.5% of total starts during the boom years of 1971-72 but less than 4.0% during the bust years of 1974-75. As a result, the production of subsidized units actually accentuates housing instability.
This also tends to be the impact tendency of federal housing outlays as a whole. Between 1969 and 1973 as housing production realized rapid expansion, the ratio of federal housing outlays to total outlays increased fourfold. Then as housing production declined swiftly in 1973-74, this percentage also declined. In conclusion, it is clear that any impact federal housing outlays did have on production acted to exacerbate housing instability.
Tax Expenditures
Another aspect of government expansion is reflected by federal government tax expenditures.[10] Tax expenditures is the term used to account for those tax revenues which the federal government does not collect because income subject to tax is reduced by special provisions, credits, deductions, exclusions, and exemptions.[11] For example, the deductibility of medical expenses is generally accepted as a tax expenditure.[12] Total federal tax expenditures for 1967 were $36.6 billion while by fiscal 1974 they amounted to $72.7 billion.
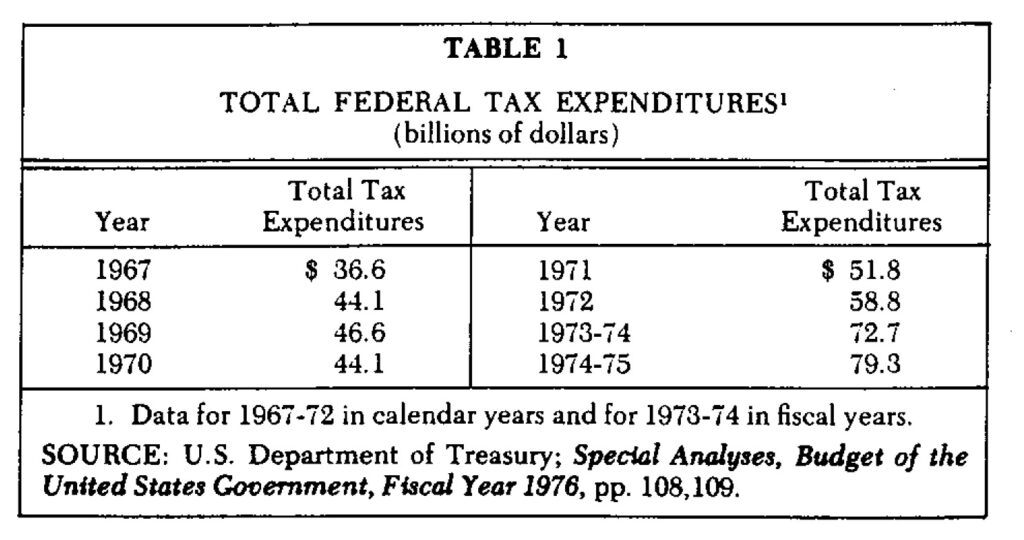
This represents a doubling in less than eight years with the result that in 1974 the federal government expended revenues in this form amounting to almost 6% of GNP. Federal tax expenditures and outlays combined accounted for nearly 40% of the nation’s total product in 1974.[13]
Tax Expenditure Mix
As federal tax expenditures have increased so has the allocation by function. These allocations, however, have not all increased equally, revealing once again changing national priorities. For example, consider the area of income security. Tax expenditures in this area include such items as the deductibility of medical expenses, the exclusion of sick pay, the exclusion of unemployment benefits, and additional exemption given those over 65. In 1967, tax expenditures in this area were an estimated $15.6 billion or 43% of total tax expenditures. By fiscal 1975, tax expenditures in this area totaled $27.2 billion or 34% of the total—a clearly declining tax expenditure priority.
By way of contrast, tax expenditures for state and local government are an increasing priority. This tax expenditure essentially reflects the exclusion of interest on state and local debt and the deductibility of nonbusiness state and local taxes. These expenditures were estimated at $4.6 billion in 1967 and $13.1 billion in fiscal 1975. As a result, state and local tax expenditures increased from 13% of total tax in 1967 to 17% in 1975.
Housing Tax Expenditures
Another way the federal government impacts the housing market is with its use of federal tax expenditures. Once again, housing must compete with other national priorities. As a result, the success of housing in this competition also reveals in part the national priority status of housing.
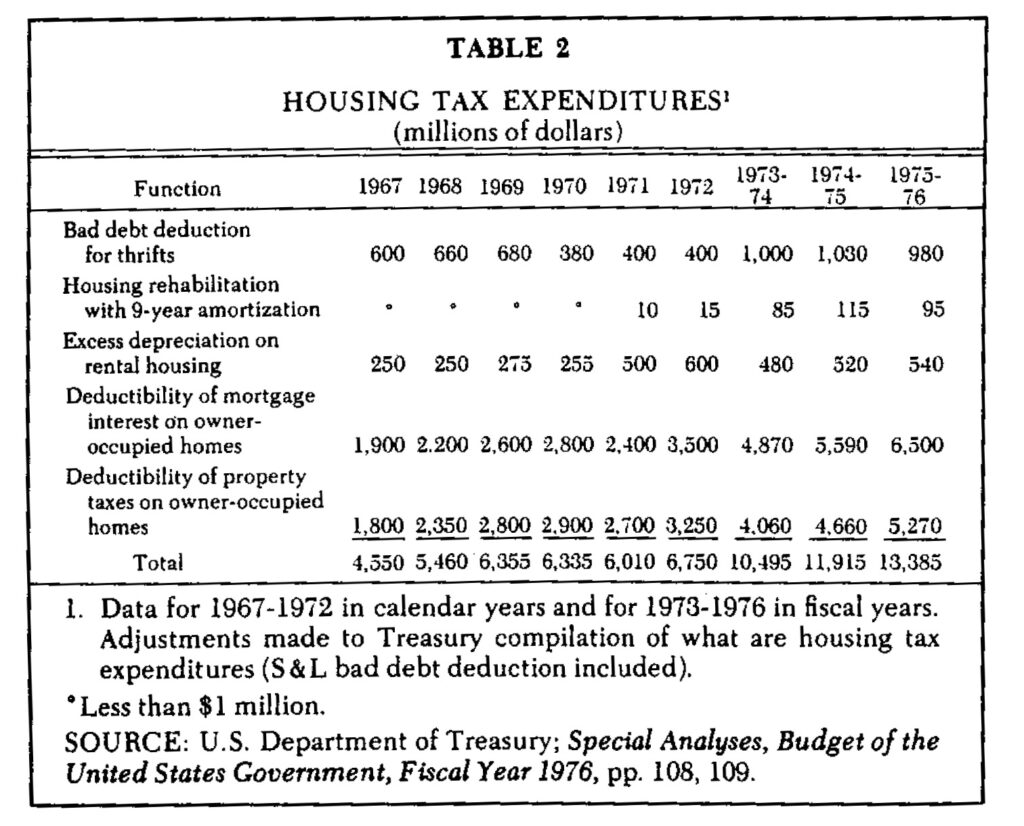
Housing tax expenditures reveal an uptrend. Included in this area are the deductibility of mortgage interest, the deductibility of property taxes, and the bad debt deduction for thrift institutions. Tax expenditures for housing were estimated at $4.6 billion in 1967 or 12% of the total. By fiscal 1975, these expenditure estimates had increased to 15% of the total or $11. 9 billion. Housing is thus an increasing national priority from a tax expenditure perspective.
Goals
As was noted earlier, the U.S. has been fairly successful in achieving its 1970 housing production goals. The level of attainment does appear to be inversely related to the size of housing tax expenditures. As housing production expanded between 1970 and 1972, the size of housing tax expenditures decreased from 14.6% to 11.3% of total tax expenditures. Then in 1972-75 as housing production leveled off and then declined sharply, housing tax expenditures increased from 11.3% to 15.0% of total tax expenditures. These trends indicate that federal tax expenditures for housing have had a stabilizing influence on housing during the volatile 1970s.
Federal Credit Programs
Government also has grown as a supplier of credit.[14] Credit assistance is provided through a number of programs which range from direct loans to private loan guarantees and interest rate subsidies. In 1965, federal credit programs advanced $8.9 billion or 13% of all the funds advanced in U.S. credit markets to nonfinancial sectors. By 1970, credit advanced under federal auspices totaled $17.4 billion while in 1974 it amounted to $26.6 billion. This resulted in federal credit programs supplying 20% of the credit advanced to nonfinancial sectors in 1970and 15% in 1974.
Another aspect of the federal government’s impact on the nation’s credit market is reflected when the total funds raised under federal auspices (borrowing for federal credit programs and federal deficits) is compared to the total funds raised by nonfinancial sectors. In fiscal 1965, funds raised under federal auspices were $6.1 billion or 28 % of the market total. This percentage increased to 34% in fiscal 1970 as federal funds raised totaled $18.1 billion and 34% in fiscal 1974 representing $25.1 billion.[15] In fiscal 1975, federal credit programs are estimated at more than $31 billion and federal funds raised were projected at $62 billion.[16]
Housing Credit Programs During the 1970s, the federal government expanded its own mortgage market participation. This was accomplished through legislation fostering the growth of a relatively new form of housing assistance-the federal credit program.[17]
These programs operate through a number of federal agencies. The government has established live major institutions to expand the flow of credit to housing, particularly during times of restrictive monetary policy. They are: Federal National Mortgage Association (FNMA), Government National Mortgage Association (GNMA), Federal Home Loan Mortgage Corporation (FHLMC), Farmers Home Administration (FmHA), and Federal Home Loan Bank System (FHLB).[18]
During the early 1970s federal government utilized several of these agencies to subsidize housing credit through its tandem programs, originated in 1969 to provide mortgage financing for the subsidized 235 and 236 housing programs. Using the National Housing Act, the President authorized GNMA to purchase subsidized housing mortgages at par or at modest discounts. As GNMA issues a commitment to purchase a mortgage, it simultaneously obtains a commitment from FNMA to purchase the mortgage at its free market price. The tandem or piggyback process acts to minimize the impact of tandem programs on the federal budget balance.
In 1971, the tandem program was extended to FHA mortgages insured under unsubsidized programs and to VA guaranteed mortgages. During 1974, a further extension of the concept was made as GNMA was permitted to purchase conventional mortgages. The program grew rapidly between 1971 and 1974. and from 1971 to 1973 GNMA extended new home commitments of $0.8 billion. By contrast, in 1974 alone, GNMA made $7 billion in new commitments.[19]
The increasing importance of these federally-supported agencies is substantiated by the distribution of residential mortgage loans. In 1955 and 1965, these agencies accounted for only about 3% of the mortgage loans outstanding while by 1974 their holding increased to better than 11%.
Conclusion
The preceding analysis of federal budget trends of the past half-century, together with the analysis of the related areas of federal tax expenditures, indicates clearly that the federal government is increasingly consumptionoriented. This tendency on the part of the federal government is revealed not only by the simple growth of federal spending, its changing composition, and its changing priorities.
The implications of the consumption orientation of the federal government and thus the nation as a whole can be derived from the fact that housing is an investment good. As immediate consumption increases, the resources available for investment become more limited and the competition for them are more intense. Recent history indicates that housing does not do well as the intensity of competition for funds in the credit markets escalates.
One result of this crunch on funds is the appearance of disintermediation at thrifts. A milder but related aspect is the high cost of funds to all intermediaries. These difficulties have an obviously negative housing impact.
This situation is aggravated further by less direct aspects of the federal consumption orientation. Housing has not been aided by the lack of major energyrelated investments and the resulting promise of ever-higher costs. Similar problems can be anticipated if in the future a lack of investment incentives creates shortages of building materials and other housing inputs.
What is worrisome about these trends is that with the allocation of government outlays increasingly oriented toward stimulating aggregate demand, the huge and growing credit needs of the government represent the tapping of our limited nation’s credit pool to finance primarily non-durable consumption purchases. The implications of this are clearly detrimental to those creditintensive durable goods industries such as housing.
Endnotes
1. Adolf Wagner was a noted German theorist of the 19th Century. See James M. Buchanan, The Public Finances, e.g. rev. ed. (Homewood, Ill.: Richard D. Irwin, Inc .. 1965), p. 50.
2. Although measuring problems are significant when government activity is being discussed, simple budget data substantiates Wagner’s law; see Buchanan, The Public Finances, pp. 30-32.
3. Total government expenditures as a percentage of GNP differs from the sum of state and local expenditures/GNP plus federal expenditures/GNP. This is the result of programs such as federal revenue sharing which create double counting problems.
4. Policy: The Eclectic Economist Views the Controversy, ed. James J. Diamond (Chicago: DePaul University, 1971), pp. 51-74; Gardner Ackley, “Fiscal Policy and Housing,” Housing and Mortgage Policy, Federal Reserve Bank of Boston, Conferences Services No. 4 (October 1970), pp. 9-40; Arnold Harberger. David J. Ott, and James S. Duesenberry, “Discussions”; Leonell C. Andersen, “A Monetarist View of Demand Management, The United States Experience,” Review 53, Federal Reserve Bank of St. Louis (September 1971).
5. James R. McCabe, “‘The Full Employment Budget: A Guide for Fiscal Policy.” Monthly Review, Federal Reserve Bank of Richmond (May 1972).
6. The Budget of the United States Government, Fiscal Year 1976 (Washington, D.C: U.S. Government Printing Office. 1975), p. 109.
7. Ibid.
8. Estimates of Housing Needs, 1975-1980, prepared for the Committee on Banking, Housing and Urban Affairs, United States Senate (Washington. D.C.: U.S. Government Printing Office, 1975), pp, 2-4.
9. “Housing Starts,” July 1975. Department of Commerce, C20-75-7 (Washington. D.C.: U.S. Government Printing Office, 1975). pp. 4 and 6; and United States League of Savings Associations.
10. Some indication of the widespread use of this mechanism by the federal government is shown by John L. Siegfried, “Effective Average U.S. Corporation Income Tax Rates,” National Tax Journal 27 (June 1974), pp. 245-259, in his computation of the effective corporation income tax rates for 100 industries in 1963. He found that the average effective tax rate was 39% as opposed to the nominal corporate tax rate for that year of 52%.
Further evidence of the use of tax expenditures is noted in Stanley S. Surrey and William F. Hellmuth, ‘”The Tax Expenditure Budget-Response to Professor Bittker,” National Tax Journal 22 (December 1969). pp. 528-537; Secretary of the Treasury, U.S. Treasury, “The Tax Expenditure Budget: A Conceptual Analysis,” Annual Report of the Secretary of the Treasury 1968 (Washington, D.C.: U.S. Government Printing Office. 1968); B. I. Bittker, “The Tax Expenditure Budget-A Reply to Professors Surrey and Hellmuth,” National Tax Journal 22 (December 1969), pp. 538-542; and Barry M. Blechman, Edward M. Gramlich, and Robert W. Hartman. Setting National Priorities: The 1976 Budget (Washington, D.C.: The Brookings Institution, 1975).
It is noted in the Brookings’ publication that tax expenditures for 1976 would sum $91.8 billion-$21.0 billion in tax subsidies to the corporate sector (44% of corporate tax revenues) and $70.8 billion for individual households (67% of income tax revenues).
11. Estimates of Federal Tax Expenditures, prepared by the staffs of the Treasury Department and Joint Committee on Internal Revenue Taxation, Committee on Ways and Means, U.S. Congress, June 1, 1973 (Washington. D.C.: U.S. Government Printing Office. 1973), pp. 1-3.
12. Special Analyses, Budget of the United States Government, Fiscal Year 1976 (Washington, D. C.: U.S. Government Printing Office, 1975). p. 108.
13. Economic Report of the President, transmitted to the Congress February 1975 (Washington, D.C.: U.S. Government Printing Office. 1975). pp. 249-328.
14. The Economics of Federal Subsidy Programs, a staff study prepared for the use of the Joint Economic Committee, U.S. Congress (Washington. D.C.: U.S. Government Printing Office, 1972); and Special Analyses, Fiscal Year 1976, pp. 82-100.
15. Special Analyses, Fiscal Year 1976, p. 83.
16. For 1975 they are projected at 5.6%. See Special Analyses, Fiscal Year 1976, p. 366; and The Budget of The United States Government, Fiscal Year 1976, pp. 32-37.
17. Several studies of housing and other credit programs have been performed: note particularly Rudolph G. Penner and William L. Silber, “Federal Housing Credit Programs: Costs, Benefits. and Interactions,” The Economics of Federal Subsidy Programs, part 5, submitted to Joint Economic Committee. U.S. Congress (Washington, D.C.: U.S. Government Printing Office. 1972).
Also refer to Jack M. Guttentag, “The Federal National Mortgage Association,” in George F. Break and others, Federal Credit Agencies, prepared for Commission on Money and Credit (Prentice-Hall, 1963), pp. 67-158; Charles M. Haar, Federal Credit and Private Housing: The Mass Financing Dilemma (McGraw-Hill, 1960), pp. 74-125; and Henry J. Aaron. Shelter and Subsidies (Washington. D.C.: The Brookings Institution, 1972), p. 91.
18. 1975 Fact Book (Chicago: U.S. League of Savings Associations, 1975), pp. 70-74.
19. George M. von Furstenberg, “The Economics of the $16 Billion Tandem Mortgages Committed in the Current Housing Slump,” unpublished (Bloomington: Indiana University). p. 1.