 Photo: Wilson Araujo/Shutterstock.com
Research conducted by Norman Miller, Ph.D., University of San Diego; Jeffrey D. Fisher, Ph.D., Professor Emeritus of Indiana University; Paige Mueller, CRE, at Eigen 10 Advisors, LLC; and Michael Dinn, CRE, at Dinn Focused Marketing. Continued in Volume 42, Number 8: “Housing Demand and Immigration Trends”.
The U.S. rental housing market has been a popular and, for many, successful investment during the past decade, enabled by a number of new vehicles and investment types and spurred by disruption in the single-family-owned market as a result of the 2007 subprime crisis. Investors should be aware, however, that the market is about to undergo a significant change driven by dramatically different demographic trends. Additionally, while investors often associate public policy risks with property types such as health care, the increasing dependence on immigration in the next 15 years as the U.S. population ages creates a growing and significant public policy risk for housing and other property investments that are dependent on household growth for new demand. The following analysis is a short synopsis of research conducted by Hoyt Advisory Services1 and funded by the National Multifamily Housing Council and National Apartment Association in 2017 to forecast apartment demand in 50 states, 54 metro areas and the U.S. through 2030.
The Aging Population Base
The U.S. population is aging. In 1990, households in which the head of household was 34 or younger accounted for 27% of households, as compared to 21% aged 65+. By 2011, the 65+ age cohort surpassed the under 34 group in size, with each accounting for approximately 21.5% of the total population. Forward trends are expected to be more dramatic. Practically no growth is expected in either the under 30 aged cohort or the 45-54 aged cohort. The 55-64 aged group is even expected to shrink slightly. So where will growth come from? Not surprisingly, that large population base – the Baby Boomers or those born from approximately 1946 to 1964 – will continue to lead growth. The 75+ aged cohort is expected to account for 44% of all new household growth through 2030, followed by the 65-74 aged cohort at 36% of all new growth. The Boomers’ children, Gen Y or the Millennials (those born in the mid-1980’s to mid-1990’s), are the second source of household growth going forward; i.e., the 35-44 aged cohort will account for another 22% of all new household growth through 2030. As shown in the graph in Figure 1, rental households will follow a similar trend.
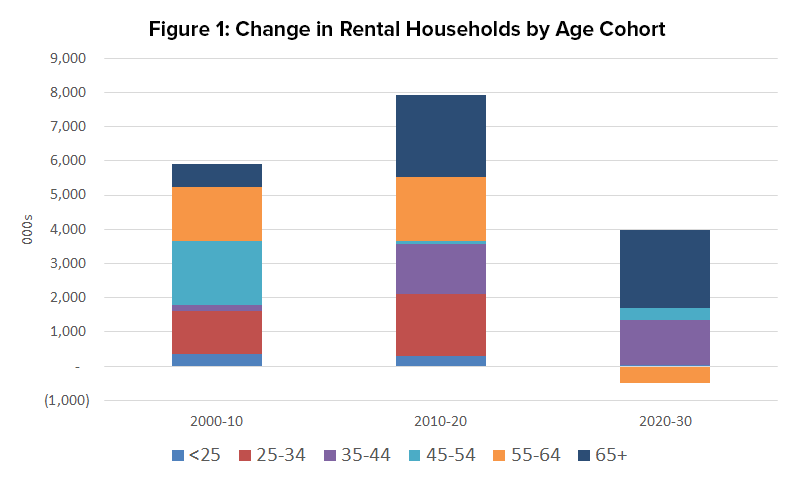
Source: U.S. Census Bureau, Hoyt Advisory Services
Trends vary significantly by region, however. Parts of the south, particularly Texas and Georgia, benefit from multiple trends. Their younger populations create positive natural population growth (births minus deaths) and they benefit from both domestic and international in-migration trends. Thus, as shown in the maps in Figure 2, population growth in some of these areas continues to look very much like the trends from the past decade, with growth across all age groups and relatively strong growth from younger renters. Conversely, much of the Midwest and Northeast have older populations and often domestic net out-migration patterns. The result is that new growth is characterized by two key trends. First, the elderly account for a very large percentage of growth by age cohort. Second, almost if not all, new population growth will be created by international in-migration.
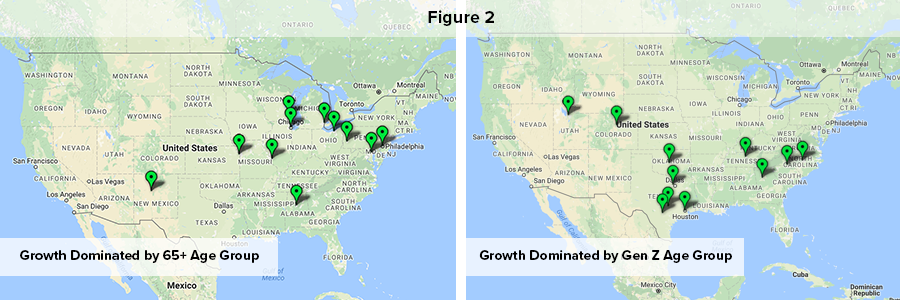
Source: U.S. Census Bureau, Hoyt Advisory Services
The Importance of Immigration
In fact, exposure to immigration policy by region is quite surprising. One might think that the border states, e.g. California, Arizona, Texas and Florida would have the biggest exposure to immigration trends given their nearby proximity to Mexico and trade patterns with Latin America. While trends vary significantly by location, though, many of the border states have two other key factors going for them – natural increases (births outpace deaths) and positive in-migration from other U.S. states.
Source: U.S. Census Bureau, Hoyt Advisory Services
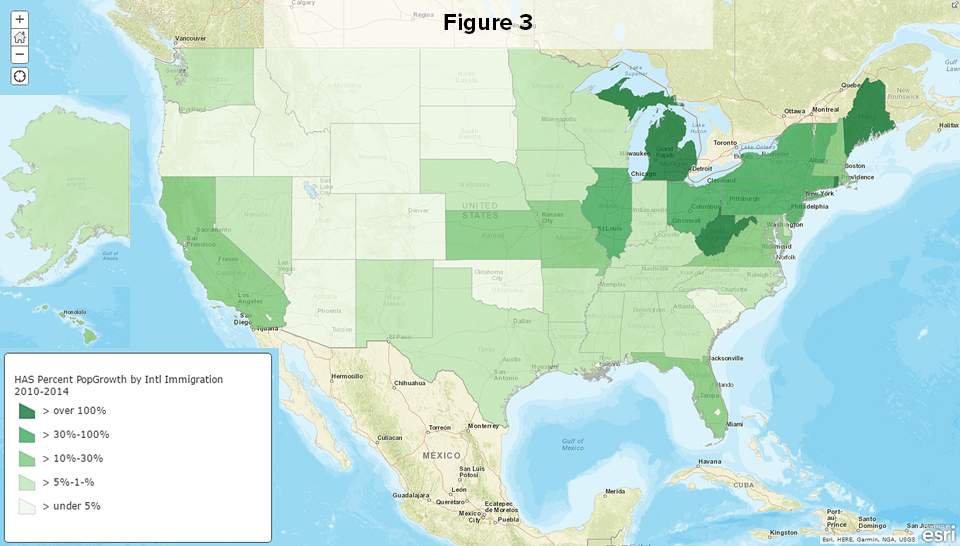
Thus, while they may have positive in-migration from other countries, the border states often have multiple sources of growth, lessening the importance of international immigration in creating growth. In fact, as shown in the map in Figure 3, it is the slow-growth areas of the Midwest and Northeast that are most dependent on international immigration to create household growth. These areas often have some combination of negative natural growth (deaths outpace births) and/or out-migration patterns to other locations. Thus, if they have positive international immigration, it may account for a large part and sometimes all forecast household growth.
Source: U.S. Census Bureau, Moody’s Analytics
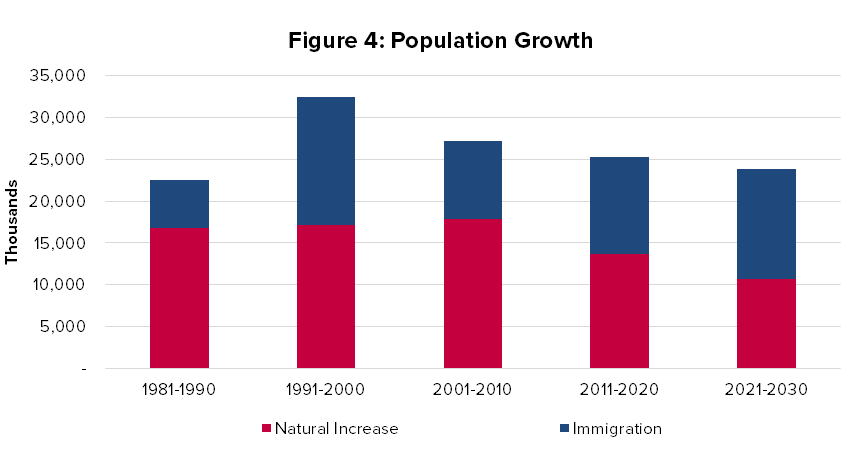
Immigration is important because as the U.S. population ages, natural growth slows and an increasing proportion of population growth will be dependent on in-migration from other countries.2 In fact, by 2023 international immigration is expected to account for a larger proportion of U.S. population growth than natural increases. This has large implications for investors. First, population growth, which in turn allows growth in employment and revenues, is the base of demand forecasts for all property types. Without any immigration, U.S. population growth will slow from 0.7% in 2016 to 0.4% and even further to 0.25% by 2030. This would create significantly less demand for new real estate. Second, areas in which a large part of population growth is expected to come from immigration now have a significant policy exposure. That is, we are less certain of growth in these markets because of policy uncertainty, and thus expect higher errors in any demand models. It would be worth reviewing whether this uncertainty is currently being integrated into underwriting policies. Third, international immigrants have different demographic and real estate profiles, e.g. they have a higher propensity to rent. We will explore these trends in a separate upcoming article focused on the impact of immigration on apartment markets.
Downward Pressure on Homeownership Rates
Older people are more likely to own their home. In fact, homeownership rates increase from 35% for households under 35 years old to 79% for households aged 65+.3 Thus, the aging population base will put upward pressure on homeownership rates.
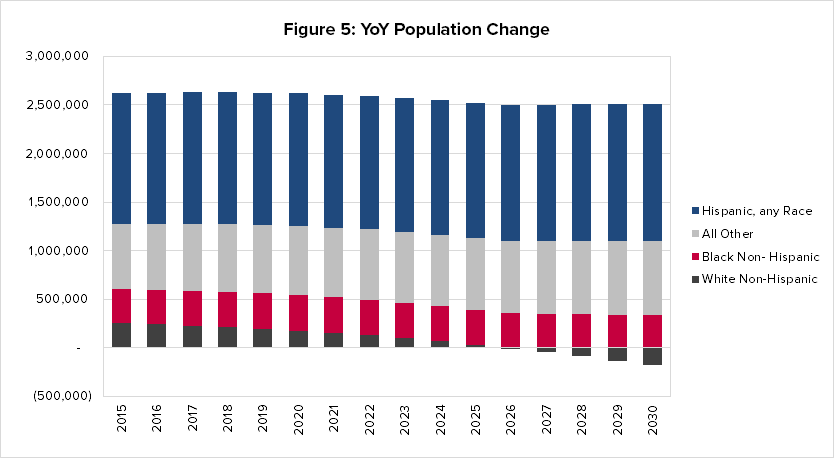
However, a number of factors will create a long-term downward pressure on homeownership rates. As discussed in Figure 4, a large proportion of growth is expected to come from international immigrants. This portion of the population has much higher rentership rates, particularly when they first enter the U.S. Most population growth through 2030 will also come from non-white households. Homeownership rates drop drastically from 72% for White, Non-Hispanic households to 46% for Hispanic (from any race) households and 41.5% for Black Alone households.4
First-time home-buyers are a large component of home sales. While the average age of first-time buyers is 32 years, similar to previous trends, first-time homebuyers accounted for 34% of all home sales5 in a 2017 survey, down from 40% or higher prior to 2005. The Gen Y / Millennials born in 1980 to 1998 accounted for 34% of home buyers in 2017; 49% have kids under the age of 18 and 66% were first-time homebuyers.6 Of concern is that young people continue to delay family formation, and thus potentially become new home buyers. The age at first marriage was 27.4 for women and 29.5 for men in 2016, up from 22.3 and 24.7 respectively in 1980.7 The mean age at first birth is also on the rise, at 26.3 in 2014 up from 24.9 in 2000.8 Homeownership rates fell the furthest for young households in the recent downturn with homeownership rates for the 35-44 age segment falling from 70% in 2004 to 58.4% by 2016 and from 43.3% to 35.2% during the same time period for the Under 35 age cohort.9 Recovery will be further delayed by higher unemployment rates in the younger age cohorts and increased student debt. We estimate that $50,000 in student debt could reduce spending power by about $450 per month. Given average rents in major metro areas of around $1,621 as of 4Q 2016,10 this is a significant decline in spending power. For the above reasons, we estimate that homeownership rates are unlikely to continue rising, and could potentially even decrease slightly through 2030.
Affordability and Construction
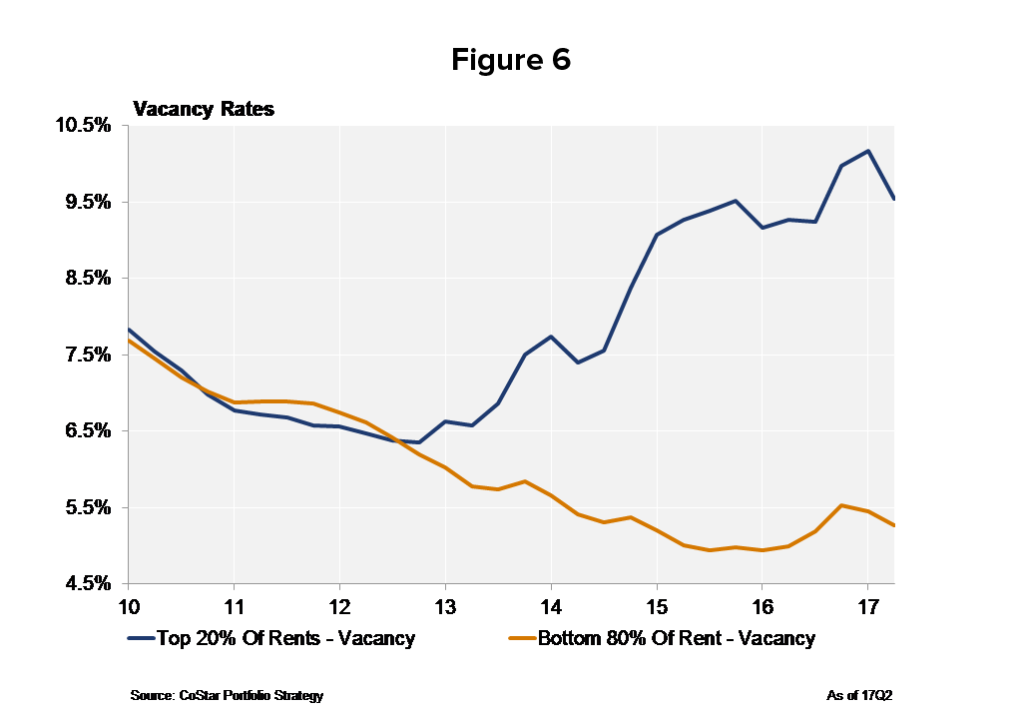
Driven by strong demand, the U.S. apartment market has experienced a robust construction cycle during the past four years, to the point that occupancy peaked in late 2015 and rents began weakening by late 2016.11 Significant variances exist though, both by price point and by region. In fact, many areas throughout the country continue to face severe affordability issues. The summary data masks two key trends. First, recent vacancy trends reflect lease-up of new construction. As shown in the graph in Figure 6, vacancy increases in aggregate are limited to properties whose rents are in the top 20% of the market; i.e., these properties reflect newly constructed properties that are in lease-up as well as high-end properties that are competing with new construction. Vacancy rates for properties whose rents are not among the top 20% in price are up slightly but remain near the 2016 low. Second, rental rate growth has consistently been the highest for properties with the lowest rents.12 Thus, rents are increasing even in the more affordable segment of the market. We thus have affordability problems rising at both ends of the pricing spectrum in many markets.
Source: U.S. Census Bureau, Hoyt Advisory Services
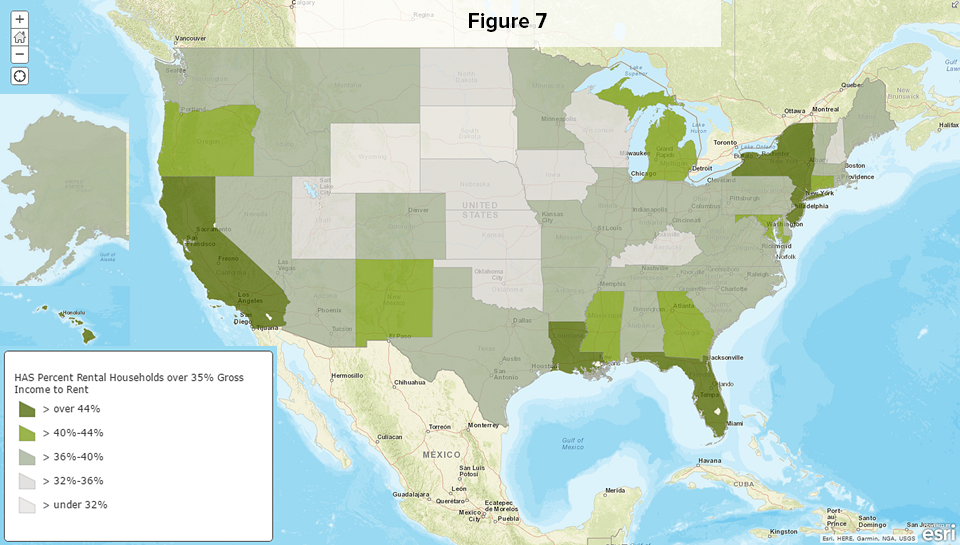
As shown in the map in Figure 7, apartment rental costs remain high even as compared to high incomes in areas such as California and New York where more than 44% of households are spending greater than 35% of income on rent.
Source: U.S. Census Bureau, Hoyt Advisory Services
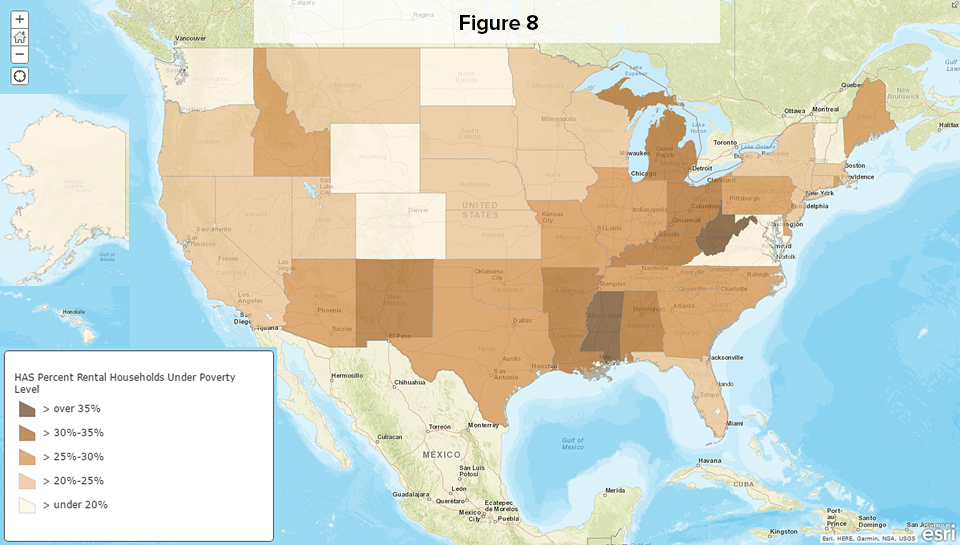
At the other end of the spectrum, 31% of renters nation-wide earn less than $20,000 per year. These households are particularly located in the Southeast as shown in the map in Figure 8.
The Forecast – Serving Market Segments
Overall, we forecast a need for another 4.6 million new apartment units in the U.S. through 2030.13 More than a million of these units will be needed in just five markets: New York, Dallas-Ft. Worth, Houston, Miami-Ft. Lauderdale and Atlanta, although strong growth is occurring in many markets, particularly in the southern parts of the U.S. Demographic changes will dictate changes in product type, with particular needs for properties aimed at older renters. Additionally, housing affordability has already become a critical issue even in markets that are experiencing a significant amount of new supply which generally caters only to the top price tiers of the market. High-cost markets that cannot provide affordable housing risk further out-migration pressure to more affordable markets, many of which also have educated population bases. Finally, investors must consider the policy risk and implications associated with immigration which will become a larger part (or known-unknown) of the population growth forecast.
Endnotes
1. Research conducted by Dr. Norman Miller, University of San Diego; Dr. Jeffrey D. Fisher, Professor Emeritus of Indiana University; Paige Mueller, CRE, at Eigen 10 Advisors, LLC; and Michael Dinn, CRE, at Dinn Focused Marketing. Retrieved from https://www.weareapartments.org/NMHC-NAA-US-Apartment-Demand-in-2030.pdf ↩
2. We modeled a conservative approach to growth assuming that immigration could slow in the next four years given current immigration policy uncertainty. The U.S. Census and other sources assume a more aggressive, straight-line growth to immigration over the next 14 years. ↩
3. U.S. Census Bureau, 2016 ↩
4. U.S. Census Bureau, 2016 ↩
5. “2017 Profile of Home Buyers and Sellers,” National Association of REALTORS, October 2017. Retrieved from https://www.nar.realtor/sites/default/files/documents/2017-profile-of-home-buyers-and-sellers-11-20-2017.pdf ↩
6. “Home Buyer and Seller Generational Trends 2017,” National Association of REALTORS. Retrieved from https://www.nar.realtor/sites/default/files/reports/2017/2017-home-buyer-and-seller-generational-trends-03-07-2017.pdf ↩
7. U.S. Census Bureau ↩
8. CDC / NCHS, National Vital Statistics System ↩
9. U.S. Census Bureau ↩
10. CBRE Econometrics, sum of 61 metro markets ↩
11. CBRE Econometrics, sum of 61 metro markets; data as of 2017Q3. ↩
12. CoStar 2017Q2 ↩
13. Multi-family 5+ units or about 16% of the total US housing stock. For methodology see the full report under www.weareapartments.org. ↩