 Photo: Arthimedes/Shutterstock.com
Research conducted by Norman Miller, Ph.D., University of San Diego; Jeffrey D. Fisher, Ph.D., Professor Emeritus of Indiana University; Paige Mueller, CRE, at Eigen 10 Advisors, LLC; and Michael Dinn, CRE, at Dinn Focused Marketing. Continued from Volume 42, Number 6: “Housing Demand is About to Change – Here’s Why”.
Introduction
A recent study commissioned by the National Multifamily Housing Council (NMHC) and the National Apartment Association (NAA) through Hoyt Advisory Services forecasts multifamily housing demand through 2030 for the U.S., all states individually, and 56 selected metropolitan and geographic areas.1 As part of this study, immigration was considered as one source of future demand for U.S. housing.
What was not expected in this study was how critical immigration is, and how it increasingly will be a source of future population growth. Immigration is currently providing approximately 45% of the U.S. population increase, and in a few years could provide more than 50% of the net new housing demand. Because of aging, U.S. population growth, including immigration, has already slowed from 1% in 2001 to 0.7% by 2016, and could slow by half this pace through 2030 without positive immigration growth. Immigration to the U.S. is important as a source of labor, including both high-skilled labor, where the U.S. has shortages, and low-skilled labor, where many Americans prefer not to work. These shortages are particularly important given the low rates of unemployment in 2018. Additionally, migration between cities is a strong indicator of the economic health and prospects of each metro area.
Interestingly, some slow-growth cities with poor in-migration patterns from other U.S. cities will be completely dependent on international in-migration to create population growth going forward or will risk experiencing a shrinking and aging population base. These cities are not necessarily where you think they might be – many are non-border cities, particularly in the Northeast. And while some would argue that the world certainly doesn’t need more people, an aging population base that has reached retirement cannot be supported by the transfers inherent in the current entitlement system based on a shrinking younger counterpart.
Population size and growth are the underlying base factors of real estate demand estimates. While demographic and age trends are somewhat predictable, the current debate surrounding immigration policies now puts a large band of uncertainty (or error margin) around future real estate demand. We set out to understand what parts of the country are at more risk due to this uncertainty.
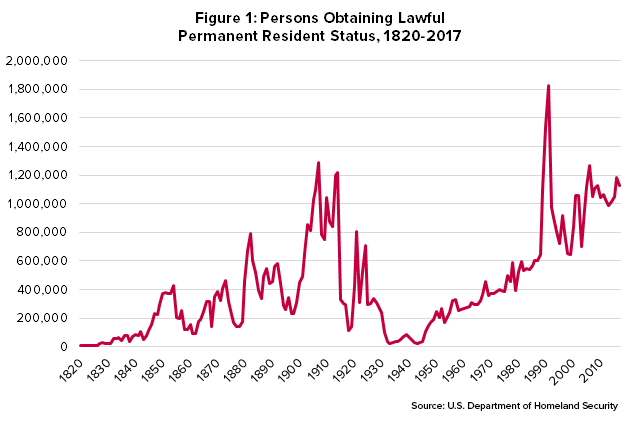
The Department of Homeland Security estimates that 845,951 people received lawful permanent resident status in the first three quarters of 2017, down by 5% from the year before as shown in Figure 1. Nearly half (46%) of those residents came from seven countries: Mexico, China, India, Cuba, Dominican Republic, Philippines and Vietnam. Similarly, the number of non-immigrant admissions by academic students was down by about 5% to 879,947 in the first half of 2017. However, economists and other organizations have raised concern about immigration policy going forward. Prior to the 2016 election, Moody’s Economy.com team issued a report entitled “The Macroeconomic Consequences of Mr. Trump’s Economic Policies”2 stating that Trump’s policies would be a “significant retreat from the increasing globalization of the U.S. economy.” Since the election, we have observed a steep decline in the number of foreign applicants to U.S. universities, increased challenges for tech companies staffing engineers and programmers, and a general decline in the number of foreign applicants for U.S. visas.3, 4, 5 Figure 1 tracks lawful immigration over time.
Immigration as it impacts population growth is dependent on net migration – that is, incoming minus outgoing immigrants. In Figure 2, we show the relative contribution of the net immigrant population to the natural population increase (based on births minus deaths). Given uncertainty in near-term immigration policy, we use a conservative estimate of immigration to estimate near-term population growth for housing demand projections, bringing the pace down from recent trends and closer to the pace of 2000-2010.6
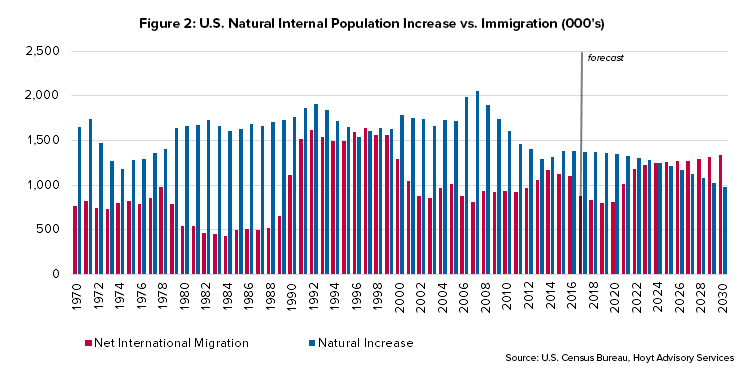
The decline in the expected rate of U.S. immigration shown in Figure 2, which could last four or even eight years, creates a significant reduction in the rate of population increase. Net immigrant population is expected to exceed the natural domestic population increase by 2023 and that could still be the case, depending on policy changes and the results of upcoming elections. It is clear that our annual rate of natural population increase for the U.S., as a whole, is headed towards zero by 2038.7 States such as Maine are already showing very little population increase. Not only does this affect the supply of workers in the local and regional economy, but it also affects contributions into Social Security and Medicare which may become insolvent that much sooner, perhaps by 2029 without the labor supplied by legal immigration.8
Immigration Policies Analyzed
A formal analysis of two distinct immigration policies was recently completed by REMI9 and commissioned by the Business Roundtable.10 In one case, REMI analyzed the economic implications of “strict enforcement” of current U.S. immigration laws. This policy would include deportation and voluntary departures along with an aggressive border security program. In the other scenario, they considered “balanced reform”. The balanced reform policy includes improved border security, but also allows H-1B reforms to permit temporary high-skilled workers, H-2A reforms to allow temporary agricultural workers, and some temporary H-2C lower-skilled workers, green card reforms that eliminate the lottery but consider needed skills, and a pathway to legal status for those brought here as children and/or working here for many years without criminal records. The H-2A workers are critical to the agricultural industry, especially in California, and the H-2C workers are especially important in construction, waste management, food service, repair services, personal and laundry services and serving private households. The H-1B program is especially important to universities and high-tech firms that cannot find sufficient engineers and computer programmers.
The conclusions of this study are as follows, where each is compared to a baseline economic scenario over the period of 2018-2027:
| Balanced Immigration Reform | Stricter Enforcement |
| GDP grows by 3.9% more than otherwise | GDP is reduced by 3.0% |
| 8.4 million more jobs created | 6.9 million jobs eliminated |
| Raises real incomes by 2.3% | Lowers real incomes by 1.3% |
California is hit especially hard by a lower supply of temporary workers in the agricultural industry and fewer high-skilled workers in Silicon Valley. The REMI study suggests that the California GDP will increase by $831 billion in 10 years or decline by $640 billion, depending on the immigration policy path followed. Other states significantly affected, listed from west to east, include Nevada, Texas, Arizona, Oregon, Florida, New York, Pennsylvania, Virginia, Massachusetts, Rhode Island, Connecticut, Delaware, Maryland, and New Jersey. The Business Roundtable concluded: “While strong border security is an essential component of any reform proposal, this analysis demonstrates the importance of simultaneously addressing the economy’s need for additional legal immigration channels.”11
Immigration and Demographics Trends Intersect Producing More Renters
The U.S. housing market is being buffeted by opposing forces. Home ownership rates rise with age. In Figure 3, we observe the degree to which older population should create upward pressure on homeownership rates.
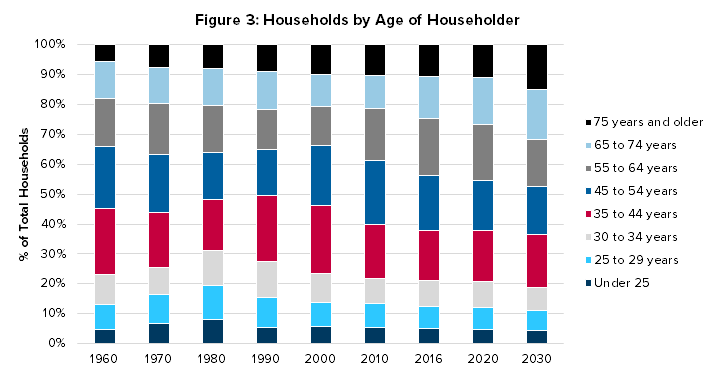
As of 2017, 65% of the rental demand is 35 years or older and this is only increasing. At the same time, we have seen delayed marriages and delayed childbirth, which has resulted in a lower ownership percentage. Student loans are also contributing to this lower ownership trend.12
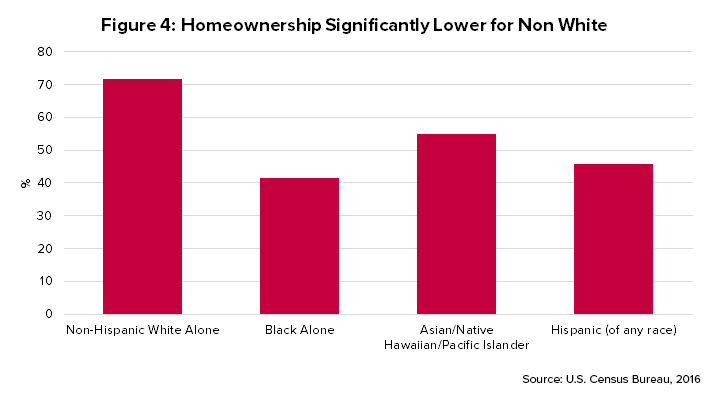
When demographic trends are considered, we observe that for the next dozen years or so, more than half of the U.S. population growth will come from Hispanic growth13 (see Figure 4). This group has had increasing home ownership for several years, but at 45%, we will continue to see overall U.S. homeownership rates decline even with a homeownership rate increase for the Hispanic households.
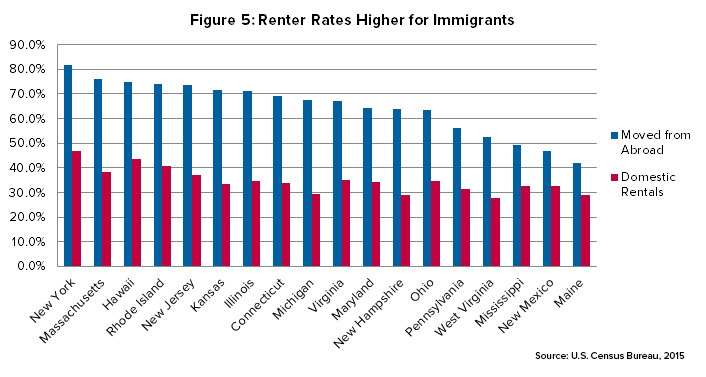
Additionally, international immigrants are much more likely to be renters (as shown for selected states in Figure 5) for a variety of reasons, including: uncertainty over expected tenure in any given location, uncertainty over residency status, less financial literacy, and lower incomes and less wealth for down payments, as historically these group exported much of their excess cash to relatives from their country of origin.
When the impact of an aging population is combined with immigration trends, student loans, stricter mortgage underwriting, higher interest rates, and delayed marriages, we expect to observe a generally lower homeownership rate over the next several years, possibly dipping below 60% if interest rate increases materialize.
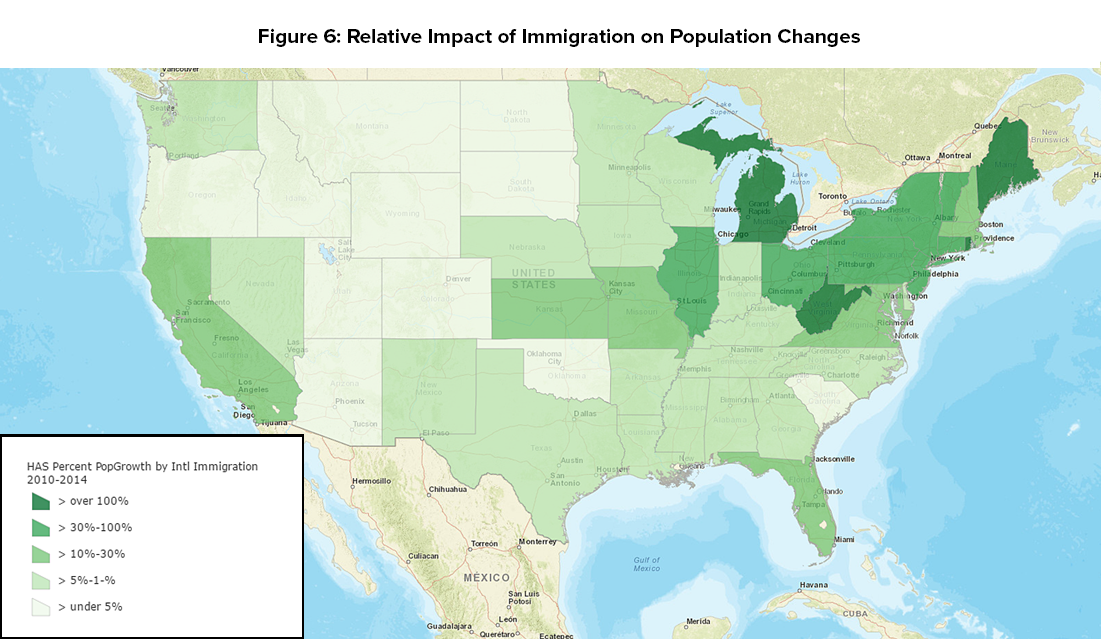
With respect to regional immigration and U.S. natural population increases, it is worth noting that the impact of immigration is much greater in markets where the natural population growth rate has slowed or stopped entirely. In Figure 6, we show a map where the darker green areas are those most affected by a lack of natural population increase and net migration from other states, and thus become highly dependent on international in-migration for any positive population growth. States most affected are not the border states which often have younger population bases and positive in-migration from other states. Interestingly, those most dependent on international in-migration for growth include states such as Maine, Michigan, West Virginia and generally the Northeast U.S.14 We have the highest uncertainty in real estate demand in these areas as it has the most exposure to national immigration policies.
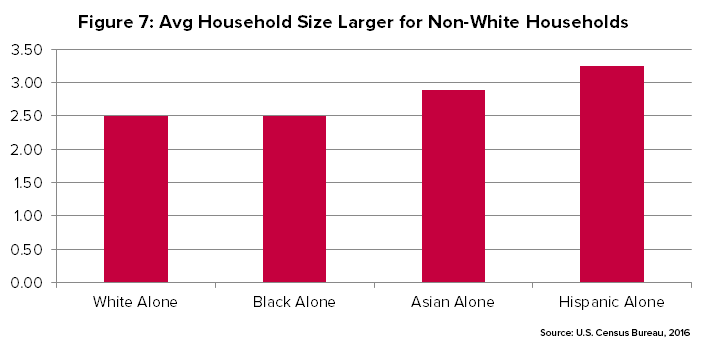
Demographic trends and rental demand were covered in more detail in a prior article by the same research team,15 but here we simply note that the demographic trends will increasingly force greater demand for larger rental units. Figure 7 measures household size differences by ethnic groups. Keep in mind that the fastest growth is among the Hispanic group.
Looking at metropolitan areas, we find that the Hispanic renters are already very significant in the following markets where they make up more than 20% of all renters.
| Market | % Hispanic Renters |
| San Antonio | 53.1% |
| Miami-Ft. Lauderdale | 46.9% |
| Riverside | 45.9% |
| Albuquerque | 45.0% |
| Los Angeles | 40.7% |
| Houston | 35.1% |
| Orlando | 32.7% |
| San Diego | 32.5% |
| Austin | 31.6% |
| Phoenix | 30.4% |
| New York | 30.1% |
| San Jose | 28.6% |
| Las Vegas | 27.4% |
| Dallas-Ft. Worth | 25.2% |
| Denver | 23.4% |
| Chicago | 21.0% |
| San Francisco | 20.5% |
| Salt Lake City | 20.5% |
| Sacramento | 20.3% |
Asians are also a significant immigrant group and they are most important in the following metro markets, where they make up more than 10% of the renters. Asian immigrants are more likely to be working in higher-skilled jobs, such as technology, and are often recruited by companies with U.S. labor shortages.16
| Market | % Asian Renters |
| Honolulu County, Hawaii | 31.4% |
| San Jose-Sunnyvale-Santa Clara, CA Metro Area | 30.9% |
| San Francisco-Oakland-Hayward, CA Metro Area | 20.5% |
| Los Angeles-Long Beach-Anaheim, CA Metro Area | 13.8% |
| Seattle-Tacoma-Bellevue, WA Metro Area | 11.0% |
| Sacramento–Roseville–Arden-Arcade, CA Metro Area | 10.7% |
Conclusions
Immigrants are particularly important to the economy of the U.S. where they fulfill a high percentage of the lower-skilled temporary jobs in agriculture, along with many jobs in hotels, waste management, repair services, personal services such as landscaping, childcare and house cleaning, as well as some construction jobs, such as roofing, that remain less attractive to established U.S. residents. Immigrants are also important in skilled jobs such as engineering and programming jobs, where the U.S. is not able to supply sufficient high-skilled labor. Without these immigrants and the undocumented immigrants raised here, known as the DREAMers, our U.S. economy will suffer. Some analysts predict an earlier U.S. fiscal budget solvency crisis among U.S. entitlements if a younger labor pool does not pay into the system.
In a parallel pattern, immigrants are a significant portion of the population increase, nearly equaling that of the natural increase, and expected to surpass it by 2023, although recent immigration policies have greatly threatened these trends. Immigrants are primarily renters and do add significantly to the renter demand pool. In some of the Northeast areas of the U.S., they represent 100% of the net population increase. Yet, immigrants are not evenly distributed and tend to grow faster in areas where they are already at critical mass, that is, where jobs, amenities and services can be provided that cater to various immigrant groups.
Endnotes
1. Multifamily Housing Demand Looking out Through 2030 sponsored by the NMHC and NAA. See https://www.weareapartments.org/ and https://weareapartments.org/NMHC-NAA-US-Apartment-Demand-in-2030.pdf ↩
2. In June of 2016 the team of Mark Zandi. Chris Lafakis, Dan White and Adam Ozimek put out this report. See https://www.economy.com/mark-zandi/documents/2016-06-17-Trumps-Economic-Policies.pdf ↩
3. “Trump Plans Legal Immigration Cutback” from the American Immigration Center website at www.us-immigration.com ↩
4. “Drop in foreign applicants worries U.S. engineering schools” by Jeffrey Mervis, Feb. 14, 2017, in ScienceMag.org. See http://www.sciencemag.org/news/2017/02/drop-foreign-applicants-worries-us-engineering-schools ↩
5.“Fewer Foreign Students Are Coming to U.S., Survey Shows” by Stephanie Saul, Nov. 13, 2017, New York Times. See https://www.nytimes.com/2017/11/13/us/fewer-foreign-students-coming-to-us.html ↩
6. Sources: Hoyt Advisory Services, Moody’s Economy.com, U.S. Census Bureau data as of January 15, 2017. ↩
7. U.S. Census Bureau population projections, 0.1% growth per year from natural population growth beginning 2038. ↩
8. “ITR Economics: 2019 Recession, 2030 Depression” in Seeking Alpha, by FS Staff, based on an interview with Alan Beaulieu. Looking out longer term, Beaulieu explained how ITR’s call for a 1930s-style Depression around 2030 is a mathematically-derived forecast based on a number of converging trends: global inflation, healthcare costs, entitlement spending, and a burgeoning national debt. ↩
9. REMI is a policy analytics firm. See https://www.remi.com/. ↩
10. “Economic Effects of Immigration Policies” Business Roundtable & REMI Study Presented by Fred Treyz, Nov. 2, 2017. http://www.remi.com//www/wp-content/uploads/2017/11/11-2-REMI-BRT-Immigration.pdf ↩
11. Ibid. ↩
12. “A Look at the Shocking Student Loan Debt Statistics for 2017” September 13, 2017, in Student Loan Hero. U.S. students owe over $1.48 trillion spread among 44 million borrowers, with an average balance of over $37,000, a median monthly payment of $203 and a delinquency rate of 11.2%. See https://papersowl.com/discover/student-loan-debt-statistics/ ↩
13. Demographic trends are the focus of a separate paper by Mueller, Paige. “Housing Demand is About to Change, Here’s Why,” Real Estate Issues, Vol. 42, No. 6, April 2018. See https://cre.org/real-estate-issues/housing-demand-is-about-to-change-heres-why/ ↩
14. Source: https://weareapartments.org/NMHC-NAA-US-Apartment-Demand-in-2030.pdf ↩
15. Mueller, Paige. “Housing Demand is About to Change, Here’s Why,” Real Estate Issues, Vol. 42, No. 6, April 2018. See https://cre.org/real-estate-issues/housing-demand-is-about-to-change-heres-why/ ↩
16. U.S. Census Bureau 2016 ACS Table S0505 and S0506. Foreign Born: Born in Latin America median household income = $44,338; 13% have a bachelor’s degree or higher and the largest employment industries include: construction (14.8%), education & healthcare (14.5%), and arts (13.4%). Foreign Born: Born in Asia median household income = $75,146; 51% have a bachelor’s degree or higher and the largest employment industries include: education & healthcare (23.4%), professional services (15.0%), and manufacturing (11.8%). Note that the tech industry is not an industry classification in the Census data and is thus spread among categories such as professional services and manufacturing. ↩