 Photo: s-t/Shutterstock.com
Over the last several decades, the discovery of off-site contamination from various sources such as manufacturing and industrial facilities or disposal sites has become commonplace. The offsite contamination often affects residential properties and results in concerns that it has reduced property values. These concerns can lead property owners to threaten to sue or actually sue the responsible party or parties for compensation for alleged reductions in property values. One response to such a situation is for the responsible party or parties or a government agency to buy actual or potentially affected properties from their owners. An early, and somewhat notorious example of this was Love Canal, a neighborhood in Niagara Falls, New York, in which state and federal agencies bought hundreds of homes and relocated the residents.1
Another response to the presence of off-site contamination is for the responsible party or parties to offer residential property owners what is known as a “Value Assurance Program” (“VAP”).2 For properties in a qualifying area, such a program typically offers owners the difference between the actual selling price of their property and a hypothetical market value based on some “control area” which is similar to the qualifying area but not affected by the contamination, and may possibly include compensation for closing costs and relocation expenses. Clearly, in principle, sellers of properties in a VAP have an incentive to accept a price lower than unimpaired market value for their property even if the contamination has no effect on market values because doing so reduces time on the market and the seller is guaranteed of receiving at least unimpaired market value for their property. Further if the transaction price is low enough, it may in some cases trigger compensation for closing costs and relocation expenses as well. Thus, if one observes that sale prices for residential properties in a VAP are less than unimpaired market value, the relevant question is whether it is due to the contamination, or the VAP, or some combination of the two.
This paper analyzes the effects of one such VAP on actual sale prices for residential properties.3 It is based upon a hedonic regression model of property values in Neodesha, Kansas. We find that the underlying motivation for the subject VAP, offsite groundwater contamination, had no effect on property values in the area covered by the VAP or in the rest of Neodesha. On the other hand, the subject VAP does appear to have had a temporary negative effect on property values in the qualifying area.
The next section of this paper offers several examples of VAPs. We then describe the Neodesha VAP, followed by a presentation of our hedonic regression model. A final section offers a summary of our results and conclusions based upon them.
Value Assurance Programs
VAPs typically are found in situations where a facility may have created a nuisance that could have a negative impact on property values. Examples include, but are not limited to, landfills, low-level hazardous waste disposal sites, wind farms, mines, industrial facilities and situations in which contamination or proximity to contamination may have potentially affected property values.
Typically, a VAP includes provisions outlining the process for a property owner to complete either before or after the consummation of a sale or refinancing. Compliance is imperative if the property owner alleges diminution in value and seeks remuneration from the guarantor. In theory, a property owner covered by a VAP should receive nothing less than unimpaired market value as compensation for the sale of their property. However, the property owner typically does have a responsibility during the marketing period to act in the best interest of the guarantor of the VAP, such as maintaining the physical condition of the property, making the property available for showings, and negotiating the sale price in good faith.4
Examples of VAPs include the following.5
1. Maine – Solid Waste Disposal Facilities
As stated in Title 38, Maine Revised Statute §2175-A,
Owners of property, the value of which has been affected by a solid waste disposal facility, are eligible for reimbursement from the bureau for loss in property value directly attributable to the construction and operation of the facility.
Guidelines established by the Maine State Planning Office require an owner to request reimbursement for loss of property value. The loss is based on appraisals estimating an “unimpaired value,” and also requires the property owner to sell the property for the “best possible price,” which involves a review of the marketing time, showings, use of real estate brokers, and the sale price. Compensation for any loss in property value may be determined by a sales transaction or refinancing.6
2. Illinois – Wind Farms
In connection with a wind farm in DeKalb County, Illinois, a subsidiary of Florida Power & Light, FPL Energy Illinois Wind, LLC, proposed a VAP for potentially affected properties. Property owners were required to make notification of their intention to sell, at which time an appraisal was to be completed under the hypothetical condition that there were no wind energy towers within three-quarters of a mile of the property. The appraisal would then be used as the basis for establishing an asking price. The property owner was required to make a good-faith effort to sell the property for a designated period. If the property sold for less than the established asking price, the company would pay the difference between the asking price and the sale price.7
3. Minnesota – Mining
A VAP was established for the Town of Auburn, Minnesota in December 2014, related to a sand mine. The VAP requires the owner of a qualifying property to have the home appraised to establish a “guaranteed value.” The listing price cannot be less than the guaranteed value and the VAP requires a specified listing period. If an offer below the guaranteed value is received, the guarantor has first right of refusal. If the home does not sell during the specified listing period, the guarantor will buy the home at the guaranteed value.8
4. Wisconsin – Mining
A VAP was created for the Town of Dovre, Wisconsin, in March 2014, also related to a sand mine. The VAP includes single-family and multifamily properties within one-half mile of the mine. The property owner must notify the town clerk of their intentions to sell. Prior to the sale, the property must be appraised under a hypothetical condition that the mine does not exist. The property owner and the town are to agree on an unimpaired value of the property prior to the listing of the property, which serves as the basis for any determination of diminution in value due to the mine.9
From an appraisal perspective, the point is that sales subject to a VAP may fail to satisfy the definition of market value because the sellers are not typically motivated because they effectively have a guaranteed “not below price” prior to marketing their property. As a theoretical matter, however, the key insight is that the sale price may be too low, not too high. Ultimately, the question really is an empirical one – are the incentives created by a VAP enough to affect market prices, and is there any way to separate the effects of the VAP from the effects of the externality, if any? These are the issues addressed in this paper.
The Neodesha VAP
In 1897, Standard Oil Company of Kansas constructed an oil refinery on what was then the outskirts of Neodesha, in Wilson County, Kansas. In 1970, the refinery was closed and most of the property was deeded to the City of Neodesha for an industrial park. On May 4, 2000, a map of off-site groundwater contaminated by petrochemical was published in the local newspaper.10 On May 22, 2000, the prior owner of the former refinery (“Guarantor”) sent letters to residents of a specified Program Area within the City of Neodesha that described and offered a standard VAP.11 The Program Area is shown in Figure 1.
Figure 1: Program Area (Hatched Area)
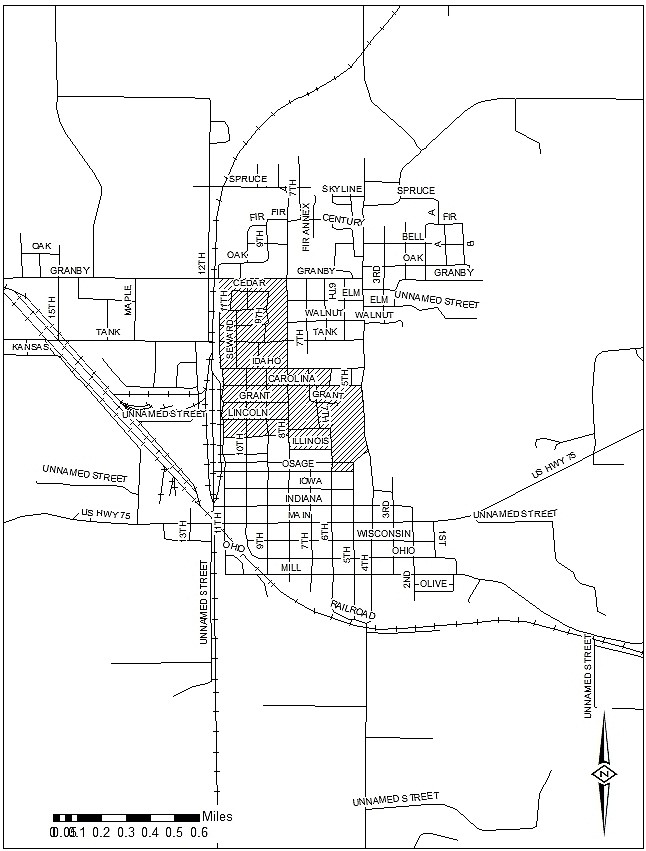
For Program Area properties purchased on or before April 27, 2000, fair market value was based on one or more appraisals using sales comparisons largely drawn from a nearby town, Fredonia. For Program Area properties purchased after April 27, 2000, fair market value was based on the original purchase price plus two percent per year from the purchase date to the sales date. If the sale price were less than fair market value, the owner would also be compensated for closing costs including broker’s commissions.
From its inception in 2000 through roughly half of 2006, 27 properties participated in the Neodesha VAP. One of these, which happened to sell at a price well below its appraised value, was a bank foreclosure. For the other 26 properties, the total appraised value was $979,300 and the total sale price was $946,775, an average discount of only 3.3%.
Sales within the Program Area between July 2000 and June 2006 were identified using data provided by the Kansas Department of Revenue. After screening these sales on the basis of various standard criteria, there were 44 sales in the Program Area, 20 of which participated in the Neodesha VAP, that were suitable for inclusion in a statistical analysis of the Neodesha VAP.
Hedonic Regression Analysis
Hedonic regression analysis is well-known in the appraisal and real estate economics literature.12 In essence, it is based upon a multivariate regression model or models which decompose actual sale prices into components associated with property characteristics such as square footage of living space, number of bedrooms, lot size, and the like.13 These are encoded as “variables,” for each of which a value factor, or “coefficient” is generated. These value factors are expressed, roughly speaking, in percentage terms.14 The variables used in our model and their definitions are shown in Figure 2.
Figure 2: Variables and Definitions Used in Hedonic Regression
| Variable Name | Definition |
| lnpr | Natural logarithm of sales price |
| sf | Interior square footage |
| lotsf | Lot square footage |
| lotsf2 | Lot square footage squared |
| bth | Number of baths |
| d_bdrm2 – d_bdrmGt4 | Series of dummy variables for number of bedrooms |
| d_garat | Dummy variable for attached garage |
| d_gardt | Dummy variable for detached garage |
| d_fp | Dummy variable for one or more fireplaces |
| d_bsmt | Dummy variable for basement |
| d_ac | Dummy variable for central air |
| d_gdplus | Dummy variable for good condition or better, as determined by the county assessor |
| d_yrblt_1800 – d_yrblt_2000 | Series of dummy variables which indicate era in which house was built |
| d_1999 – d_2005 | Series of dummy variables which indicate a sale in a particular event year |
| d_pgm_1998 – d_pgm_2005 | Series of interaction variables which indicate a sale in the program area in a particular year |
| d_fred_1998 – d_fred_2005 | Series of interaction variables which indicate a sale in Fredonia in a particular year |
The time frame for the hedonic regression model in this paper is from July 1, 1998 through June 30, 2006. Our model is based on a yearly analysis, but instead of using calendar years, we use “event years” which are based on the date at which the local real estate market became informed of the off-site contamination, sometimes called the “trigger date.”15 In this case, the trigger date is assumed to be July 1, 2000 since information regarding the off-site contamination and the Neodesha VAP was broadly transmitted to residents of Neodesha in May 2000. Thus, for analytical purposes, an event year is defined to begin on July 1 of the designated year and runs through June 30 of the following year.
Since our analysis begins at July 1, 1998, we have two event years prior to the trigger date to establish a benchmark against which potential diminution in property values can be evaluated. We then analyze the effects of the off-site contamination and the Neodesha VAP for an additional six event years by comparing sales in Neodesha to sales in the nearby town of Fredonia.16 We do this by separating sales into sales in the Program Area, sales in the Non-Program Area, and sales in Fredonia. The model includes variables that allow us to isolate the effects of each geographic area on sale prices for each event year.17 The results are shown in Figures 3 and 4.
Figure 3: Hedonic Regression Output Primary Variables
Dependent Variable: Natural Log of Price.
R2 = .799, Adj R2 = .782.
Number of observations = 626.
| Variable | Coefficient Estimate | Standard Error | Pr > |t| |
| Intercept | 8.83455 | 0.13853 | <.0001 |
| Sf | 0.00042925 | 0.00003947 | <.0001 |
| Bth | 0.12211 | 0.03307 | 0.0002 |
| Lotsf | 0.00002847 | 0.00000614 | <.0001 |
| lotsf2 | -5.52E-10 | 1.51E-10 | 0.0003 |
| d_bdrm2 | 0.21383 | 0.09968 | 0.0324 |
| d_bdrm3 | 0.24539 | 0.10264 | 0.0171 |
| d_bdrm4 | 0.22553 | 0.10967 | 0.0402 |
| d_bdrmGt4 | 0.18306 | 0.15597 | 0.241 |
| d_garat | 0.12421 | 0.03849 | 0.0013 |
| d_gardt | 0.05541 | 0.0268 | 0.0391 |
| d_fp | 0.11023 | 0.03396 | 0.0012 |
| d_bsmt | 0.15077 | 0.04915 | 0.0023 |
| d_ac | 0.19071 | 0.02927 | <.0001 |
| d_gdplus | 0.36355 | 0.03221 | <.0001 |
| d_yrblt_1800 | -0.43087 | 0.0944 | <.0001 |
| d_yrblt_1900 | -0.3814 | 0.059 | <.0001 |
| d_yrblt_1910 | -0.31112 | 0.05864 | <.0001 |
| d_yrblt_1920 | -0.26402 | 0.05782 | <.0001 |
| d_yrblt_1930 | -0.23527 | 0.06046 | 0.0001 |
| d_yrblt_1940 | -0.25428 | 0.07621 | 0.0009 |
| d_yrblt_1950 | -0.09579 | 0.06151 | 0.1199 |
| d_yrblt_1960 | 0.02474 | 0.07059 | 0.7261 |
| d_yrblt_1970 | 0.22042 | 0.07189 | 0.0023 |
| d_yrblt_1980 | 0.19394 | 0.08496 | 0.0228 |
| d_yrblt_1990 | 0.58857 | 0.11178 | <.0001 |
| d_yrblt_2000 | 0.59501 | 0.21394 | 0.0056 |
Figure 4: Hedonic Regression Output, Year Dummies and Interactions
Dependent Variable: Natural Log of Price.
R2 = .799, Adj R2 = .782.
Number of observations = 626.
| Variable | Coefficient Estimate | Standard Error | Pr > |t| |
| d_f1999 | 0.03163 | 0.08267 | 0.7022 |
| d_f2000 | 5.58E-02 | 8.88E-02 | 0.5298 |
| d_f2001 | 0.1562 | 0.08786 | 0.076 |
| d_f2002 | 0.2283 | 0.08878 | 0.0104 |
| d_f2003 | 0.20913 | 0.08075 | 0.0098 |
| d_f2004 | 0.17835 | 0.08128 | 0.0286 |
| d_f2005 | 0.24744 | 0.08505 | 0.0038 |
| d_pgm_f1998 | -0.02986 | 0.14396 | 0.8357 |
| d_pgm_f1999 | -0.0009679 | 0.12289 | 0.9937 |
| d_pgm_f2000 | -0.11818 | 0.10362 | 0.2545 |
| d_pgm_f2001 | 0.00022223 | 0.14509 | 0.9988 |
| d_pgm_f2002 | -0.11415 | 0.1342 | 0.3954 |
| d_pgm_f2003 | -0.43119 | 0.12946 | 0.0009 |
| d_pgm_f2004 | -0.11201 | 0.10709 | 0.296 |
| d_pgm_f2005 | 0.00205 | 0.12337 | 0.9867 |
| d_fred_f1998 | -0.06579 | 0.07703 | 0.3934 |
| d_fred_f1999 | -0.05621 | 0.07151 | 0.4321 |
| d_fred_f2000 | -0.02143 | 0.07724 | 0.7816 |
| d_fred_f2001 | -0.16172 | 0.07617 | 0.0342 |
| d_fred_f2002 | -0.10843 | 0.08026 | 0.1772 |
| d_fred_f2003 | -0.03114 | 0.07012 | 0.6571 |
| d_fred_f2004 | -0.07636 | 0.06524 | 0.2423 |
| d_fred_f2005 | -0.03784 | 0.07029 | 0.5905 |
The results of the hedonic regression model shown in Figures 3 and 4 are both statistically sound and consistent with the predictions of economic theory. To illustrate the changes in property values over time across the Program Area, the Non-Program Area, and Fredonia, we have constructed a “representative property.” A representative property is defined by a specified set of property characteristics that are “typical” of properties in the neighborhoods being analyzed. In this case, the representative property has 1,387 square feet of living space on a 6,300-square foot lot. It has three bedrooms, two bathrooms, a garage, and central heating and air conditioning.18 The coefficients from the results shown in Figures 3 and 4 are used to predict a value for this property in each area in each year. The projected values for the representative property in each of the three areas are shown in Figure 5.
Figure 5: Projected Values for Representative Property
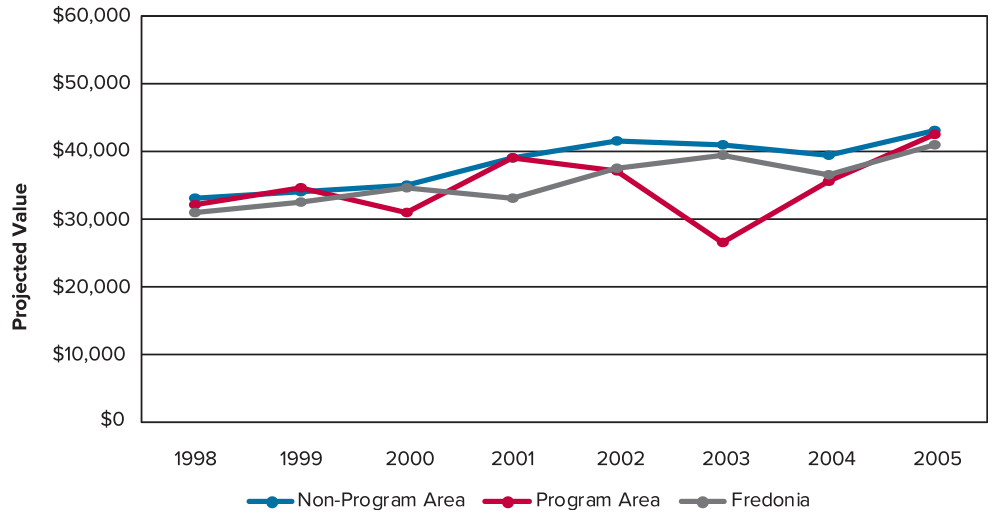
Figure 5 reveals that property values during the two benchmark event years, 1998 and 1999, were essentially identical across the three areas.19 For the first three years after the local real estate market became informed of the off-site contamination, July 1, 2000 through June 30, 2003, there was no statistically significant difference between property values in the Program Area and the Non-Program Area, and both were equal to or greater than property values in Fredonia except in event year 2000 when property values in the Program Area were lower than in the Non-Program Area or Fredonia, the difference not being statistically significantly. In the following year, the fourth year after the local real estate market became informed of the off-site contamination, event year 2003, property values in the Program Area fell, and were much lower than those in the Non-Program Area and Fredonia, the difference being statistically significant. In the remaining two event years, there were no statistically significant differences between property values in the three areas, and by event year 2005 they were once again essentially identical.
It is immediately apparent from Figure 5 that the announcement of off-site contamination had no negative effect on the value of residential property in the Non-Program Area. Property values in the Non-Program Area were consistent, and essentially identical to or higher than the control area, Fredonia, throughout the study period. Furthermore, announcement of off-site contamination had no statistically significant effect on the value of residential property in the Program Area compared to the value of residential property in the Non-Program Area or Fredonia except in event year 2003, the fourth year after the announcement. The question is whether the temporary decline in the value of residential property in the Program Area in event year 2003 was due to the contamination or the Neodesha VAP. In our opinion, it is the latter.
There are two primary reasons to conclude that the temporary decline in the value of residential property in the Program Area was due to the incentives created by the Neodesha VAP and not by the off-site contamination. The first is that despite the incontrovertible fact that there was widespread awareness of the off-site groundwater contamination emanating from the former refinery site beginning in mid-2000, there was no statistically significant difference between the values of properties in the Program Area compared to the Non-Program Area for the following three years. Furthermore, property values in the Non-Program Area were either essentially identical to or outperformed those in Fredonia over the entire study period. This means that if the off-site groundwater contamination were the cause of the price decline in event year 2003, there would have been a three- to four-year lag between the time the local real estate market became informed of the contamination and the time that it had an effect on property values. There is no credible evidence of such a delayed effect in the appraisal or real estate economics literature.20
The second reason that we hold that the temporary decline in the value of residential property in the Program Area was due to the incentives created by the Neodesha VAP is based on the rate of participation in the Neodesha VAP. In particular, our hedonic regression model includes 18 transactions in the Program Area in event years 2000 and 2001, only six of which participated in the Neodesha VAP. But in event years 2002 and 2003, there were 12 transactions in the Program Area, nine of which participated in the Neodesha VAP. In event years 2004 and 2005, there were 17 transactions in the Program Area, only seven of which participated in the Neodesha VAP. In other words, the decrease in property values in the Program Area in 2002 and especially in 2003 occurred precisely when the percentage of participation in the Neodesha VAP was highest.
Coincidentally, the Neodesha Lawsuit was filed in March 2004, which was in event year 2003. It is unclear whether this played any role in the dip in property values in the Program Area in event year 2003.
Summary and Conclusions
The use of VAPs to allay the concerns of nearby property owners has, and likely will continue to be, a useful tool for mining companies, solid waste contractors, wind farm operators, and various manufacturing and industrial concerns. The Neodesha VAP was initiated because of groundwater contamination and provided a form of insurance to homeowners for whom the contamination may have had an effect on their property value. The hedonic regression model presented in this paper indicates that property values within the VAP followed trends for the control areas, or unimpaired properties, until event year 2003, which coincides with the filing of the Neodesha Litigation. The root cause for this temporary decrease in property values and their recovery in event years 2004 and 2005 in the Program Area cannot be known for certain, but it was unlikely to have been related to the groundwater contamination because prior to the filing of the litigation and after event year 2003, property values in the Program Area followed trends in the remainder of Neodesha and/or Fredonia. Furthermore, a significantly higher proportion of sales in the Program Area participated in the Neodesha VAP in event years 2000 and 2001, and in event years 2004 and 2005, than in event years 2002 and 2003. Thus, in our view, it is reasonable to infer that the incentives created by the Neodesha VAP caused the temporary drop in property values. It would be erroneous in this case to attribute them to the contamination.
It is also significant, in our view, that there is no evidence from actual sale prices that the off-site groundwater contamination had any effect on property values in Neodesha outside the program area. The Neodesha VAP encompassed all properties located above initial estimates of the extent of the plume of contaminated groundwater, but property value diminution was claimed for the entire town of Neodesha in the Neodesha Lawsuit. Our results clearly show that neither the Program Area nor the Non-Program Area suffered property value diminution from the contamination associated with the former refinery.
Jack Williamson, Ph.D., assembled databases and performed statistical analyses for parties involved in numerous large-scale, high profile lawsuits. In particular, he analyzed the effects, if any, of environmental contamination on property values in dozens of real estate markets throughout the U.S. The results presented in this paper are based on one such statistical analysis. The paper was co-authored before his untimely death in 2017.
Endnotes
1. See, e.g., https://www.health.ny.gov/environmental/investigations/love_canal/lcreport.htm#relocation, last accessed October 16, 2018. Property buyouts can be used to preempt law suits or as part of a settlement agreement after litigation has begun. ↩
2. For a discussion of the design and structure of Value Assurance Programs see Jerry M. Dent II & Christina M. McLean, “Value Assurance Programs: An Alternative Response to Property Value Disputes,” 20 Environmental Litigator (Spring 2009). ↩
3. Our analysis is restricted to the potential effects of groundwater contamination and a related VAP on residential property values. Whenever we refer to property values, we implicitly mean residential property values. ↩
4. See Dent and McLean (2009) for further discussion. ↩
5. See also Orell C. Anderson, Louis Wilde, and Alexander R. Wohl “Value Assurance Programs and Environmental Contamination: Assessing the Impacts,” Environmental and Energy Litigation, American Bar Association, 4, No. 2, August 29, 2018. ↩
6. State of Maine, Executive Department, State Planning Office, Chapter 475, p. 1. See www.maine.gov/sos/cec/rules /07/105/105c475.doc. Accessed January 30, 2015. ↩
7. The draft agreement was for a project by FPL Energy Illinois Wind, LLC, with up to 119 turbines, to be located in multiple townships in DeKalb County, Illinois. See https://dekalbcounty.org//www/wp-content/uploads/2018/11/cd-fpl-exhibit-wapp.pdf. Downloaded January 30, 2015. ↩
8. See https://townofauburn.net//www/wp-content/uploads/2016/06/Property_Value_Guarantee_Summary.pdf, accessed January 30, 2015. ↩
9. See http://www.townofdovre.com//www/wp-content/uploads/2014/03/Superior-Silica-Sand-Dovre-Property-Value-Guarantee-Res%E2%80%A6.pdf, accessed January 30, 2015. ↩
10. “Amoco Reveals Possible Cleanup of Refinery Residue,” The Neodesha Derrick, May 4, 2000. ↩
11. A copy of this letter and its attachments were produced in a lawsuit concerning the contamination associated with the former refinery and, like a number of documents and data relied upon in this paper, are a matter of public record. The lawsuit was captioned City of Neodesha, Kansas v. BP Corporation North America, F/K/A BP Amoco Corporation, et al. In the District Court of Wilson County, Kansas, and was filed in March 2004. Case No. 2004CV19 (“Neodesha Lawsuit”). ↩
12. Hedonic regression analysis is a form of statistical analysis often used in real estate valuation; see, e.g., Peter Colwell, PhD, John A. Heller, JD, and Joseph W. Trefzger, PhD, “Expert Testimony: Regression Analysis and Other Systematic Methodologies,” The Appraisal Journal, Summer 2009. ↩
13. For citations to reviews of the relevant literature see footnote 4 in Louis Wilde, Jack Williamson, and Gail Wurtzler, “Keeping the Gate Redux: More Valuation Methodologies Come Under Fire in Property Value Diminution Cases,” BNA, Inc. Toxics Law Reporter, 30, No. 19 (2015): 1-8. ↩
14. This is based on a so-called semi-log model, in which the dependent variable is the log of sales price. ↩
15. For a discussion of trigger dates see Wilde, Wurtzler, and Williamson, “Real Estate Markets are Informationally Efficient: Evidence from Buyer and Agent/Broker Surveys,” Environmental Claims Journal, 26(3):215–237, 2014. ↩
16. Fredonia is the control area for our analysis and was the source of almost all of the comparable sales used in the Neodesha VAP. ↩
17. For a discussion of the proper way to formulate a before-and-after hedonic regression model, see Rogers, Warren, “Errors in Hedonic Modeling Regressions: Compound Indicator Variables and Omitted Variables,” The Appraisal Journal, April 2000, pp. 208-13. ↩
18. The qualitative nature of the conclusions based on the hedonic regression analysis is independent of reasonable variations in the choice of a representative property, which is used only for illustrative purposes. ↩
19. By “essentially identical” we mean statistically indistinguishable; that is, they only differ at a very low significance level. In the remainder of this paper, unless otherwise stated, when we refer to statistical significance we mean the 95% confidence level. ↩
20. For a discussion of the informational efficiency of real estate markets see Louis Wilde, Gail Wurtzler, and Jack Williamson (2014). ↩