
Presented at the 9th RED Business Forum, Athens, Greece, October 13, 2014
It is an honor and a pleasure to be here today in Athens, for this very special conference. I’m taken with the conference’s overall title, “Inventing the Future — Invest in the Future.”
The future is not just something that blows in! It is powerful like the wind, to be sure. Our predecessors here in Athens called “power” dunamis. We face the future as a dynamic force. But we don’t wait for it passively. We act.
The word “invent” is derived from Latin “in-venire,” to come into. That’s its first meaning: we are coming into the future city, we are entering it. But since the 16th century “invent” has also meant to discover, to think up, to produce by creative thought. And surely that’s our challenge for the city of 2030 — to produce it in a creative way.
Just as interesting is the word “invest.” Its oldest meaning is to put on clothes. In some sense we “put on” our future city. Since the 17th century — and we have the Dutch East Indies Company to thank for this — “invest” has meant “the conversion of money to property in hopes of profit.” We not only produce our future by the power of creative thinking, we do so by means of putting money to work, through property, in order to earn a return.1
Isn’t that what cities have always been about? In ancient Athens, the Greeks gathered in the agora for commerce and for the business of the polis, the work of the citizens. This is politics in Aristotle’s sense of the word, the Politeia that Plato reflected upon in The Republic.2
So even though we want to concentrate on the future city, the one that we’ll be creatively producing, especially by our investment, we need to think a little bit about cities in history. Invention is not a god-like process — creation ex nihilo. The city of the future emerges from the city of the past and the present. And we need to understand that, to reflect upon that history.
As always, we owe a debt to Greece. Herodotus was not only the Father of History, but the first historian of cities. What do we learn about cities through history?
Well, first that they are the key to civilization. According to Sir Peter Hall’s magisterial book, Cities in Civilization, Athens is the fountainhead, followed by Florence in the Renaissance. London in the Elizabethan era advanced drama, Vienna did the same for music. Paris gave us a new language of painting, first with Monet, Degas, Cezanne, Sisley, and Renoir, followed by Picasso, Braque, Utrillo, Modigliani, and Toulouse-Lautrec. Early 20th century Berlin probed our irrationality with the theatre of Brecht, Piscator, and Weill, clued us into its urban dimension with Fritz Lang’s film “Metropolis,” and exposed the disintegration of Western values with the rise of National Socialism. 3 Our question is, “Where will cities lead us next?” Or, more pertinently, where will we take our cities?
A second point is that cities are never to be considered in isolation: cities are always situated in a broader regional context. Although we’ve known the specialized functions of cities since the time of Herodotus, we’ve gotten progressively more sophisticated in our understanding of the spatial characteristics of economies. Starting with pioneering work by Von Thunen, Cristaller, and Losch, we have come to think more and more about systems of cities, their hierarchies and their networks.4
Third, that context is often global in scope, especially as regards the network of cities seen in commercial trade. Konichi Ohmae, the former senior partner running McKinsey & Co.’s Asian practice, has argued in books like The Borderless World and The End of the Nation-State5 that cities and their regions are the most effective agents in the world economy. How New York relates to London, how San Francisco deals with Shanghai, how Houston interacts with Riyadh, how Miami is linked to Bogota— these define our economic world in a globalized network. My organization – The Counselors of Real Estate— will be convening a conference in early 2016 on the subject “Global Cities in an Era of Change,” co-sponsored by RICS and by Stanford University in Silicon Valley — a follow-up to a similar conference we held at Harvard in 2002.
Fourth, cities are centers of capital, in all its forms — physical, financial, and human capital. More than half the world’s population now lives in urban areas — a tipping point reached just a couple of years ago, the first time in human history that this has been the case. The concentration of people, buildings and money becomes one of the 21st century’s defining features.
Just to use my own country, the United States, as an example, we can see the relative disproportion vividly. The ten largest cities6 have an aggregate population of about 25 million, or 7.8 percent of the country’s total. But their downtown office markets represent 18.8 percent of the national TOTAL office space, and their metro areas account for an incredible 45 percent of all the nation’s office area.7 And the TOP TEN doesn’t include Atlanta, Boston, San Francisco, Miami, Washington, D.C., or other major cities you might think of. The largest ten metros in population produce 32.7 percent of all goods and services produced by the nation’s 381 metropolitan areas. Our big cities punch above their weight whether measured by physical capital or economic contribution.
Remember, too, that the U.S. is atypical in that it does not have one “primate city,” a city that dominates its national economy, as London and Paris do, as Athens does. Buenos Aires fills such a role, as do Cairo, Dublin, Mexico City, Seoul, and Vienna — among others. Countries with primate cities are even more driven than the United States by what’s happening in their centers of physical, financial, and human capital.
And rounding out the list as a fifth observation, cities are the driving force behind innovation. They are not only the locus of human achievement, they are the places where human problems are most acute, most visible, and most in need of resolution.
This was true in the industrial revolution and it is no less true right now. Research by Deborah Strumsky of UNC Charlotte, Jose Lobo of ASU and others has shown that 63 percent of U.S. patents are generated by just twenty metro areas.8 Bruce Katz and Julie Wagner at the Brookings Institution issued a report last summer discussing what they call “Innovation Districts,” places where innovative firms and talented workers are “choosing to concentrate and co-locate in compact, amenity-rich enclaves in the core of central cities.” Cities turn out to be hotbeds of entrepreneurship.9
These five attributes — historical, yet contemporary and shaping our future — are absolutely germane to our headline topic of inventing and investing. They are also critically important to understanding the phenomenon of 24-hour cities, their characteristics, their economic and real estate performance, and their future.
It’s a curious term — “the 24-hour city.” It feels like it has been around forever, but the publication Emerging Trends in Real Estate claims to have coined it in 1994, just 20 years ago. The assertion published back then was that 24-hour cities would produce superior real estate investment performance compared with those cities whose downtowns were truly just Central Business Districts — places where commuters came to work from 9 a.m. to 5 p.m., and they headed home to residential suburbs. Emerging Trends over the years has evolved the term to characterize Live-Work-Play urban environments. The salient features are a mix of uses (housing, retail, office), good public transportation access, a safe and secure environment, attractive neighborhoods proximate to downtown and a multidimensional range of recreational/cultural amenities.
Emerging Trends’ approach presented a descriptive definition only. My own research10 has sought to measure the variables, so that an operational distinction can be made between 24-hour cities and the far more numerous cities that have more restricted activity. Using, as a working hypothesis, two sets of cities discussed over the years as “24-hour” or “9-to-5” by Emerging Trends, a criteria set measurably distinguishing the two types of city was discovered. Here it is.11
24-hour cities have at least four of the following six characteristics:
- More than 13 percent of daily automobile traffic between the hours of 9 p.m. and 5 a.m.
- More than 25 drug stores open 24-hours, within 10 miles of the city center.
- City Population density of 9,000 per square mile or greater.
- A Regional Distinctiveness Rank12 above 20.
- A Crime Rate lower than 6,000 per 100,000 population.
- More than 38 percent of workers using non-auto transportation to commute.
None of the listed 9-to-5 cities satisfy more than two of the criteria. New York satisfies all six; Boston, Chicago, San Francisco, and Washington, D.C., meet five of the standards; Las Vegas and Miami satisfy four.
The identified criteria were found to be strongly correlated with other attributes including large downtown residential populations, strong Walkscores, significant college and university populations, and the number of “Edge Cities” within the metropolitan area.
So there do exist measurable criteria that we can use to target the “24-hour-ness” of specific cities. The question remains, what difference does it make for real estate investment?
Until recently, the real estate industry believed that 24-hour cities would produce superior investment results but had never rigorously tested the proposition. I believe that my doctoral research was the first such test, and I’m very happy that the academic literature is now beginning to build off that research foundation.13 Statistically significant differences in office space density, occupancy measures, rents, operating ratios, cumulative investment returns and transaction prices all emerge from the data.
Although they were roughly equal in population and employment in the 2000 US Census, the 24-hour cluster has 1.3 billion square feet at the Metropolitan Statistical Area (MSA) level, versus 760 million square feet for the 9-to-5 cluster. At the Central Business District (CBD) level, the 24-hour markets have 3.6 times the volume of offi ce buildings when compared with 9-to-5 downtowns, 737 million square feet versus 207 million.
Since 1987, 24-hour downtowns have averaged occupancy rates 5.4 percentage points better than 9-to-5 downtowns, fluctuating in a fairly narrow range. In terms of inflation adjusted office rents, 24-hour cities have enjoyed a $12.36 per square foot advantage. This is partly due to higher occupancy, but begs the question of why tenants would pay more for 24-hour city locations instead of moving to lower cost cities or lower cost suburbs. The reasons are related to productivity and profits.
From a landlord’s perspective, rents only tell part of the story. Although operating expenses and real estate taxes are substantially higher in 24-hour downtowns, they are not higher relative to the rental levels. The “operating expense ratio” (that is, the costs of operation divided by rent received) averages 43.2 percent for 24-hour downtowns, compared with 48.7 percent for 9-to-5 CBDs, a 5.5 percentage point difference. Owners get to keep more of the rent as net operating income in 24-hour markets.
Cumulative investment returns for 24-hour downtown offices have been twice as high as returns in 9-to-5 downtowns since 1987. Given these verified conditions, investment capital flows have been sustained at high levels. Capital sources of all kinds, domestic and international, private and public market (REITs) firms, large institutions and consortia of small investors have all combined to deploy investment disproportionately into the 24-hour cities — led by New York above all.
Using the term “disproportionately” means by comparison with the population base, with the employment base and even with the inventory of commercial space available for investment. The only measure with rough proportionality of office investment flows is a critical one: gross city product. This is critical, since it helps explain the superior real estate performance: 24-hour cities are more economically productive than 9-to-5 cities. That is, there is a 36 percent higher Gross City Product in the 24-hour cluster of Metros, and even accounting for the more recent growth of jobs an 8 percent advantage in output per worker, so that with every new worker added in a 24-hour city, the output gap widens.
Through the first decade of the 21st century, 24-hour downtowns attracted $231 billion in office building investment, 4.7 times the amount of investment in the comparison 9-to-5 markets. Prices reflected the capital volume differential, with 24-hour CBDs averaging a 76 percent premium in price per square foot.
Has this pattern held after the Great Recession? Yes, it has. Over the first nine months of 2014, the 24-hour downtowns saw $36 billion in office investment, versus $16.7 Billion in the 9-to-5 CBDs. The weighted average price per square foot in the 24-hour downtowns this year has been $505, while in the 9-to-5 downtowns prices average $207, indicating a pricing premium favoring the 24-hour cities of 144 percent. Capital volumes and pricing clearly demonstrate how investors value the attributes of 24-hour markets as supporting superior economic performance.14
If the analysis stopped here, it might warrant a pat on the back for real estate owners, but it really wouldn’t cause those who care about cities to stand up and cheer. If all we found was that 24-hour cities generated high prices, what would be the lesson for the future? We need to probe, I feel, for the reasons behind the prices. What makes for the success of the 24-hour city economy? How does the high value of its commercial property support that success? The value of the real estate has to be more than just a way of keeping score. It is a dynamic variable in the complex urban economic structure.
Let’s look at a few of the many ways commercial real estate, in the context of 24-hour cities, impacts the urban economy. I’ll pick three particulars to discuss. You can think of more, I’m sure.
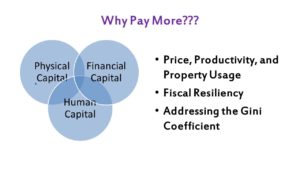
Price, Productivity, and Property Usage
Why in the world would tenants pay high rents in the most expensive cities, and why would investors believe that competition would not bring the stratospheric prices of the “superstar cities” back to earth? The answer lies at the intersection of physical, financial, and human capital. Obviously, the preference for 24-hour city investments — from both domestic and worldwide capital sources — is the financial circle in this Venn diagram.
The physical capital issue is two-fold.
- At the level of the property, 24-hour cities support the usage of commercial space for longer periods each day. Firms realize that their rent pays for space that is in place 24-hours each day, every day of the year. However, they only get value from that space when their employees are at work. In 24-hour cities, offices do not “go dark” in the evening as they do in cities where the workforce jumps in their cars by 6 p.m. and heads home for the suburbs. With more intensive utilization of the space over time, company revenues expand. Space in use is a productive asset; idle space is unprofitable.
- At the level of the city, we recognize a similar dynamic. Cities have tremendous investment in infrastructure of all kinds: transportation, communications, utilities, and so forth. If that capacity is idle for more than half the time each day, there is money going to waste. Take highways, for example. Cities build road capacity for peak usage: the rush hours. For 9-to-5 cities, those highways are virtually empty after nine or ten in the evening. That’s true even in traffic-clogged Los Angeles, Atlanta and Dallas. But traffic studies paint a very different picture for New York, Miami, Chicago and San Francisco. What’s true of traffic is also true of electrical usage. We build for peak capacity everywhere, but cities have vastly different off -peak usage patterns. 24-hour markets are more efficient in their use of public physical capital, as well as commercial physical capital. That makes them more sustainable environmentally as well.
A Resilient Fiscal Platform
The confluence of real estate market factors has resulted in a reliable, deep, and broadly distributed commercial property tax base in 24-hour markets. This is a key to fiscal resilience in the face of shocks, whether economic, political, or environmental. In a world where event risk increasingly dominates business strategic planning discussions, and where investors need to protect their downside risk, the resilience of a city cannot be stressed too strongly. Every place — New York, Washington, New Orleans, Madrid, London, Mumbai, Tel Aviv and Athens — is subject to shocks, to “black swan” events. Although we do everything we can to mitigate the risks, bad things will happen. The key question is whether and how the cities can bounce back.
After 9/11, for example, New York was faced with vast challenges, beginning with the clean-up of Ground Zero at the World Trade Center site, but including the damage to transportation infrastructure, communications systems and the strain on the City’s health and public safety networks. Federal aid helped, but New York needed to rely on its own resources as the primary foundation for economic recovery, provision of public services and plans for future growth. The same story can be told for the devastation visited on the City by Mother Nature in the form of Superstorm Sandy a couple of years ago and by our self-inflicted financial meltdown in 2008.
How could New York afford to absorb these shocks and not only regain balance, but grow at a faster rate than the nation over the past dozen or more years? A large component of New York’s fiscal platform is the $21 billion collected from the property tax, which of course is a function of the value of the real estate. As we’ve seen, that value is linked to the city’s 24-hour character, which in turn enhances its overall economic vitality. Just as a healthy body is more disease resistant than a weakened body, so healthy cities can resist both generalized economic illness and recover from acute trauma. Long term commercial leases undergird reliable cash flow for office buildings, and it is that reliable cash flow that permits New York to undertake long-range planning to fund its operations, provide services, and expand its physical capital, as it does in PlaNYC 2030.15
Real Estate and the Gini Coefficient
I don’t want to minimize the social and economic stress that accompanies the success of the 24-hour cities. As capital flows in torrents to relatively few markets, the consequent increase in real estate prices produces real strains on affordability for businesses and households alike. Although the Occupy Wall Street movement petered out fairly swiftly, without the discipline of real organizing behind it, it did leave a legacy behind. The stark level of income inequality captured by labeling “the one percent and the 99 percent” brought this topic into public discussion to a degree not experienced before. And it turns out that some of the 24-hour cities — New York and Miami in particular — have income gaps that are among the most severe in America.16
Counterbalancing that, though, is the fact that 24- hour cities like New York, San Francisco, Boston, and Washington, D.C., rank among the top ten in income mobility, according to the Equality of Opportunity Project — a joint effort of Harvard and University of California at Berkeley.16 9-to-5 cities, including Atlanta, Dallas, Philadelphia and Phoenix, show much lower odds for children born into the lower one-fifth of incomes to achieve incomes in the 80th percentile or above as adults. The characteristics of the 24-hour markets — their diversity, social capital, capacity for innovation, and especially the dynamic mix of industries and occupations — appear to create a more efficient economic ladder for native-born poor and new immigrants as well.
Why might this be so? I think it is due, at least in part, to some of the unusual ways that industries combine. For example, the food and fashion industries are not only staples of New York’s economy, they are industries that have many entry-level jobs, low-paying but not dead-end. But New York also is the center of the U.S. television production industry, especially the cable channels. Mix the industries together, and you have an explosion of TV “reality shows” or “competition shows” featuring restauranteurs, chefs, fashion designers and even wedding dress emporiums. What happens? First of all, the publicity increases the flow of money into New York’s food and fashion sectors. But secondly, more and more enthusiastic young people who want to make their mark in food and in fashion flock to New York. Thirdly, the expansion of these industries encourage innovation and entrepreneurship — new ethnic restaurants, local artisanal bakers, brewers, food carts for gourmands; and clothing boutiques, fashion-forward small production garment makers, and all the wholesalers and retailers that connect to them. None of these need graduate university degrees, by the way. That may be one of the secrets of success. In a phrase, it is not just the 24-hour city ingredients, it is a recipe, a chemistry of how those ingredients interact. That chemistry is what we most urgently need to research next.
Pertinently, real estate also offers such an income mobility ladder. Even in the prospering 24-hour cities, ownership of income-producing property is not an oligopoly. Small apartment buildings, storefront retail, older office properties and most typical pre-World War II buildings combining such uses, are the province of entry-level purchasers with equity under a million dollars whose path to wealth lies in the addition of value to property by personal interventions — sometimes called “sweat equity.” That’s something not to be overlooked in cities.
Conclusions
So what does it all mean as we try to imagine real estate in 2030? We do well to keep in mind the sage advice of Yogi Berra, the former player and manager of the New York Yankees, who said, “Forecasting is hard, especially when it is about the future.” Here are a few observations, which may or may not rise to the level of prediction.
- The world will have more cities, and many cities will be much bigger. We are at about the 50 percent level of urbanization globally, at a population base of 7 billion. By 2050, the United Nations projects 70 percent urbanization and a population of 9 billion.18 That means the world’s urban population grows from 3.5 billion to 6.3 billion in 35 years. 2030 is a milestone on that journey. That observation is neither new, nor is its forecast improbable. The amount of developed real estate on earth will certainly increase immensely in the next decade and a half.
- Capital will be distributed unevenly. It will flow to cities disproportionately. And, amongst cities, it will flow to those places that use the capital most efficiently. Remember, I am always speaking of all three forms of capital: physical, financial and human capital. Here’s the rub: even with the globalization of capital, it is not arbitraged toward the mean, it gravitates toward the optimum. And, it is surprisingly still correlated to local sourcing. That’s not likely to shift radically in so short a period of time as a decade and a half.
- The three forms of capital are not of equal weight, as far as cities are concerned. Evidence is accumulating that now, and into the future, it will be human capital attributes that will drive the allocation of physical and financial capital. That is a major shift in emphasis for development, requiring a re-think of incentives that heretofore have focused on subsidies for hard assets and for the owners of financial capital — large employers. Incentives need to be targeted to populations, encouraging the development of talent and of innovation, supporting human capital development while taking care not to compromise risk-taking and creativity, and the discipline of failure.
- Fourth, the process will be messy. Change comes in many forms, and is frequently surprising and often disruptive. In the 1970s, when Walt Disney established Disney World in Orlando, he set aside an area for EPCOT — the Experimental Prototype City of Tomorrow. No real city has evolved that bears any resemblance to EPCOT. Why? Because Walt — and his company — had and have no tolerance for messiness. Let me commit heresy here: messiness is a good thing. Sanitized, ownership association controlled, gated communities and their new urbanism analogs eschew messiness. But it is messy, emergent problems, that generate new solutions. The urban laboratory is not, and should not be, a sterile environment. The most successful cities will not be problem-free cities, but problem-solving cities.
So that’s our urban challenge for 2030: to invent — to produce by creative thought and action — and to invest — to convert money into assets in hope of profit. Not a simple task. But three thousand years of history, from Babylon and Athens to New York, London and Hong Kong suggest we’d be foolish to bet against our cities. Especially cities whose attributes of density and diversity, talent and tolerance, innovation and opportunity set them ahead of the game even today. ■
Endnotes
1. For the background on the words, “invent” and “invest,” see www.etymonline.com ↩
2. Frederick Copleston, A History of Philosophy, Volume 1: Greece and Rome, Image Books – Doubleday (New York, 1963) ↩
3. Peter Hall, Cities in Civilization, Pantheon Publications (New York, 1998) ↩
4. Peter E. Lloyd and Peter Dicken, Location in Space: A Theoretical Approach to Economic Geography (2nd ed.), Harper & Row (New York, 1977) ↩
5. Konichi Ohmae, The Borderless World: Power and Strategy in the Interlinked Economy, Harper Perennial (New York, 1999) and The End of the Nation State: The Rise of Regional Economies, Free Press (New York, 1995) ↩
6. They are, in order of population, as of 2012: New York, Los Angeles, Chicago, Houston, Philadelphia, Phoenix, San Antonio, San Diego, Dallas, and San Jose. ↩
7. Data from CBRE‐EA on office inventory, U.S. Census Bureau for population, U.S. Bureau of Economic Analysis for Gross Metro Product. ↩
8. Discussed in Emilia Istrate, Jonathan Rothwell, and Bruce Katz, “Export Nation: How U.S. Metros Lead National Export Growth and Boost Competitiveness,” Brookings Institution Metropolitan Policy Program (Washington, D.C., July 2010). ↩
9. Bruce Katz and Julie Wagner, “The Rise of Innovation Districts: A New Geography of Innovation in America,” Brookings Institution Metropolitan Policy Program, (Washington D.C., May 2014) ↩
10. Hugh F. Kelly, Twenty‐four Hour Cities and Commercial Real Estate Performance,” Unpublished doctoral dissertation, University of Ulster (No. Ireland), 2011. See JREPM articles cited in footnote 13 for a briefer summary and for the data sources and analysis. ↩
11. The 24‐hour cities were New York, Boston, Chicago, Las Vegas, Miami, San Francisco, and Washington, DC. The 9‐to‐5 cities were Atlanta, Dallas, Los Angeles, Minneapolis, Philadelphia, Phoenix, and Seattle. ↩
12. A measure developed by researchers Anne Markusen (Univ. of Minnesota) and Greg Schrock (Univ. of Illinois at Chicago), published in “The Distinctive City: Divergent Patterns of Growth, Hierarchy and Specialization,” Urban Studies
v.43, no 8, July 2006. ↩
13. See Drennan, MP and Kelly, HF, “Measuring Urban Agglomeration Economies with Office Rents,” J. Economic Geography, 11 pp. 481 ‐ 507 (2011); Kelly, HF, Adair, AS, McGreal, S, and Roulac, SE, “Twenty‐Four Hour Cities and Commercial Office Building Performance,” J. Real Estate Portfolio Management, 19 (2), pp. 102 – 120; Malizia, E, “Office Property Performance in Live‐Work‐Play Places,” J. Real Estate Portfolio Management 20(1), pp. 79‐84; Koster, HRA, van Ommeren, J., and Rietveld, P, “Agglomeration Economies and Productivity: A Structural Estimation Approach Using Commercial Rents,” Economica, (forthcoming). ↩
14. Data are from Real Capital Analytics database, accessed at October 3, 2014. ↩
15. See New York City’s website at http://www.nyc.gov/html/planyc/html/home/home.shtml ↩
16. Discussed by Richard Florida at https://www.citylab.com/life/2012/10/high-inequality-us-metro-areas-compared-countries/3079/ ↩
17. See the project’s website at http://www.equality-of-opportunity.org/ ↩
18. United Nations population projections can be found at http://esa.un.org/wpp/ ↩